New to Prism 7 is the ability to enter dates instead of X values. This page explains how to make graphs when you entered data this way. Another page explains how prior versions of Prism dealt with dates.
The Format Axis dialog offers two new choices when you entered dates instead of X values.
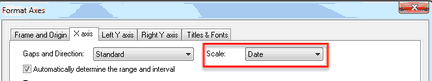
Date scale
At the top of the dialog, choose to use a Date scale.
If you choose a Dates scale, you can choose many ways to display the dates. To avoid overlap, you'll probably want the dates to be displayed vertically or at an angle (not horizontal).
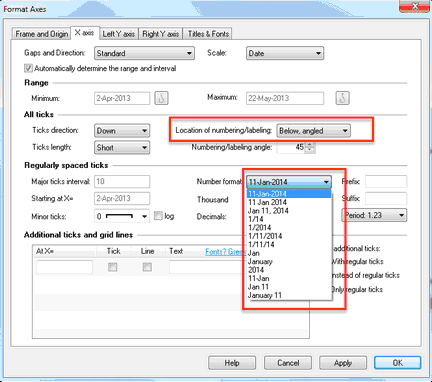
When you choose a Dates axis scale, Prism is smart about how far to space the dates. Jan 3 is much closer to Jan 1 than is Feb 3...
Linear scale for X values entered as dates
If you choose a linear (numerical) scale for X values entered as dates, Prism tells you what the units will be.
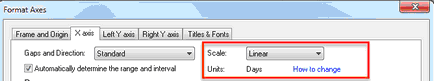
To change those units, go back to the data table, drop the Change menu and choose Format Data Table.
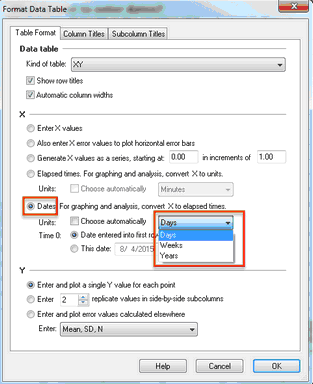
What values are used when you fit a curve or line to the data?
When you analyze XY data where X values are entered as dates, Prism converts the dates to numbers using a starting date and a date unit (days, weeks, etc.). To change this, go back to the data table, drop the change menu, and choose Format Data Table.