Choosing error bars for a grouped graph
When you create a Grouped table, choices on the Welcome or New Table dialog let you specify side-by-side subcolumns for entry of replicates, or subcolumns for entry of error values computed elsewhere. Learn more about Grouped tables.
Note an important distinction: With XY and Grouped tables, replicates are entered into side-by-side subcolumns; with Column data, replicates are stacked into columns.
When you create a grouped graph, the Plot drop down menu gives you many choices for error bars. Return to this dialog using Change..Graph Type.
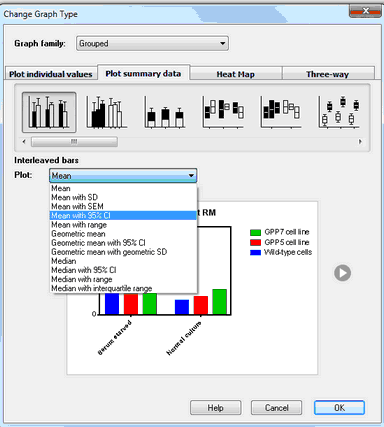
If you choose to enter error values directly, Prism will plot the values you entered (except that when you enter %CV, Prism plots the SD). If you entered Mean, SD (or SEM) and N, you can choose (on the graph) to plot the error bars as SD, SEM or 95% CI.