Entering Y replicates or error values
When you create an XY table, choices on the Welcome or New Table dialog let you specify side-by-side subcolumns for entry of replicates or error values computed elsewhere. Learn more about XY tables.
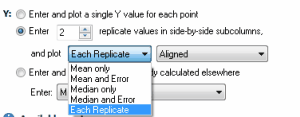
The example below is set for entry of two replicate values (duplicates) but you can choose any number from 2 to 256.
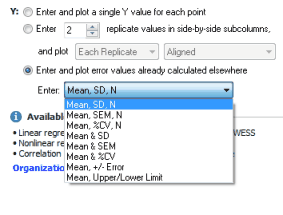
This next example is set up to enter mean, SD and N for each point.
Entering X error values
From the Welcome (or New Table) dialog, you can choose to enter X error values.
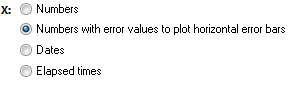
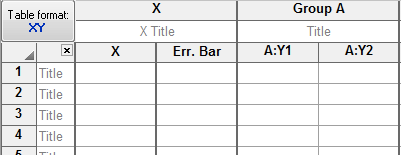
Note that you cannot enter replicate X values and ask Prism to compute error bars, nor can you separately define the right and left error values. You only can enter an error value (which could be a SD or SEM) and Prism will use that value to plot symmetrical horizontal error bars.
Error bars on graph
If you enter error values computed elsewhere, these are plotted on the graph.
If you entered replicate values in side-by-side subcolumns, Prism will plot SD or SEM error bars depending on a setting in the New Graphs tab of the Preferences dialog. You can change the choice in the Format Graph dialog.