This is an important tab, with three big choices: how to report the confidence interval of the parameters, whether to graph the confidence or prediction bands of the curve, and what to do when the data don't provide enough information to fit all the parameters.
Confidence intervals of the parameters
If the reason you want to run nonlinear regression is to interpolate unknown values, you won't really care about the values of the parameters so won't care about the confidence interval of the parameters. But if you do care about the values of the parameters, we suggest that you always ask Prism to report confidence intervals, as inspecting the confidence intervals of best-fit parameters is an essential part of evaluating any nonlinear fit.
Confidence level and output format
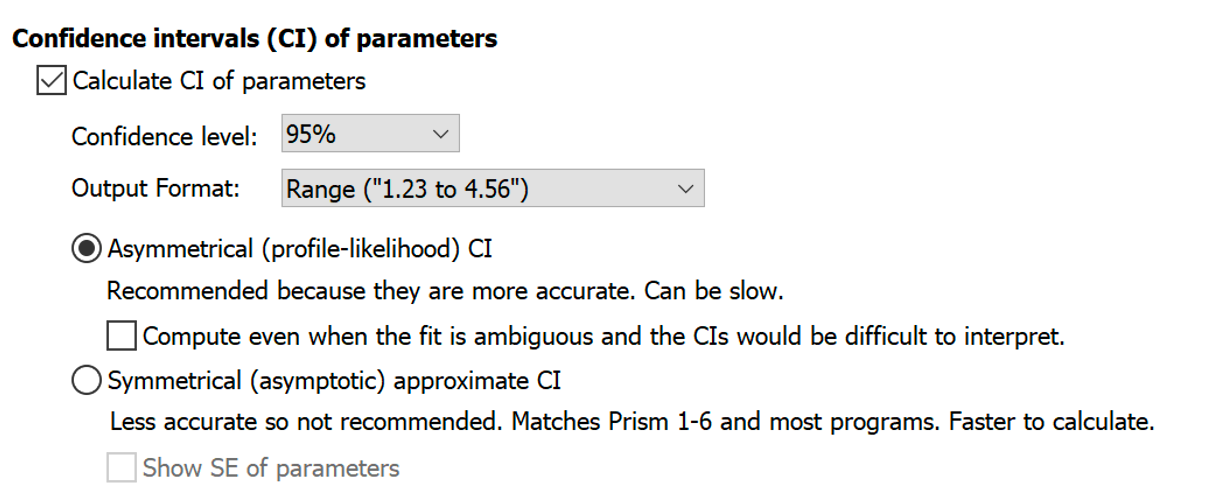
Confidence intervals are traditionally usually computed for 95% confidence, but you can choose another confidence level.
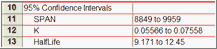
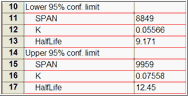
Prism can report the confidence intervals in two ways: as a range or as separate blocks of lower and upper confidence limits (useful if you want to paste the results into another program). The former is easier to read. The latter might be better if you are tabulating the results elsewhere.
|
|
How to compute the intervals
Prism offers two methods to compute the confidence intervals. Don't confuse the two choices here with the two choices for reporting the CI of parameter transforms.
•Asymmetrical (and thus more accurate) profile likelihood confidence intervals. We recommend this choice because it simply does a better job of quantifying how precisely you know the parameters value. The uncertainty often is asymmetrical, so it is better to use a method that can report asymmetrical intervals. The only disadvantage is that the calculations are more complex so are noticeably slower with huge data sets (especially with user-defined equations).
•Asymptotic approximate symmetrical confidence intervals. These are also called Wald confidence intervals. These were the only confidence intervals reported by Prism 6 and earlier and by most programs. But since the true uncertainty in the parameter's value is often asymmetrical, these symmetrical intervals are not always accurate. We suggest choosing them only when you need to compare Prism's results with other programs, when you need to be consistent with earlier work, or when you have so much data that the profile likelihood method is too slow.
If you choose the asymptotic symmetrical confidence intervals, you can also ask Prism to report the standard errors of the parameters. The standard errors are intermediate values used to compute the symmetrical confidence intervals, but are not very meaningful by themselves. You may want to include standard errors in the results to compare Prism's results to those of another program that doesn't report confidence intervals or to collaborate with colleagues who don't understand confidence intervals. But we recommend routinely turning off reporting of the standard errors, because they do a poor job of conveying the precision of the best-fit parameter values. Starting with version 8.2, Prism only offers the choice of reporting the standard error values if you choose to report the symmetrical confidence intervals.
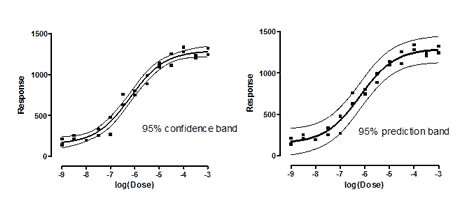
Confidence and prediction bands
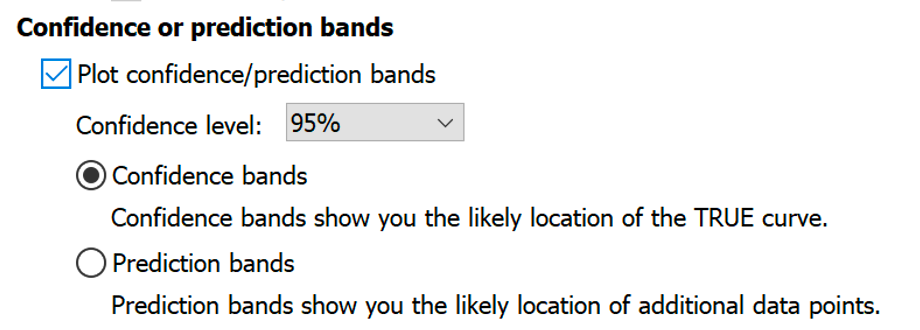
The 95% confidence bands enclose the area that you can be 95% sure contains the true curve. It gives you a visual sense of how well your data define the best-fit curve.
The 95% prediction bands enclose the area that you expect to enclose 95% of future data points. This includes both the uncertainty in the true position of the curve (enclosed by the confidence bands), and also accounts for scatter of data around the curve. Therefore, prediction bands are always wider than confidence bands. When you have lots of data points, the discrepancy is huge.
Learn more about confidence and prediction bands.
Ambiguous fits and unstable parameters

Sometimes your data simply won't define the model very well. Prism offers you three ways to deal with this situation.
•Identify "ambiguous" fits. This was the method always used by Prism 7.0 to 8.1. It is useful if you want results to be consistent with older work. If any parameter has a dependency greater than 0.9999, Prism marks the fit "ambiguous", precedes the best fit value with a tilde (~) to show it is not to be believed, and doesn't show its confidence interval. Learn more about how Prism calculates dependency.
•Identify unstable parameters. This approach was introduced in Prism 8.2 as a Prism Labs (experimental) feature. We welcome feedback. In rare circumstances, a dependency can be >0.9999 and yet it is still possible to obtain a useful best-fit value of the parameter and a useful confidence interval. Our "ambiguous" method based on dependency didn't report any results for these parameters. Our new method works quite differently and can find best-fit values or confidence intervals for data sets where the "ambiguous" method could not. When applicable, Prism will display the word "unstable" in place of that parameter's best fit value and confidence interval.
•Neither. Just report the best-fit values no matter what. This is what most other programs do.