Introduction
The defining feature of Gompertz growth is that the growth rate decays exponentially as the population approaches it maximum.
Gompertz and logistic models generate curves that are very similar. But when Y is low, the Gompertz model grows more quickly than the logistic model. Conversely, when Y is large, the Gompertz model grows more slowly than the logistic model.
Step by step
Create an XY table. Enter time values into X and population values into Y. After entering data, click Analyze, choose nonlinear regression, choose the panel of growth equations, and choose Gompertz growth.
Consider whether you want to constrain Y0 and/or Ym to fixed values.
Model
Y = YM*(Y0/YM)^(exp(-K*X))
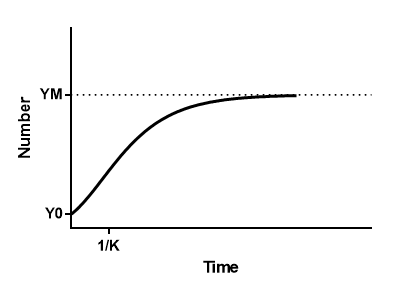
Interpret the parameters
Y0 is the starting population (same units as Y)
YM is the maximum population (same units as Y)
K determines the lag time (inverse of X time units)
1/K is the X value of inflection point