Introduction
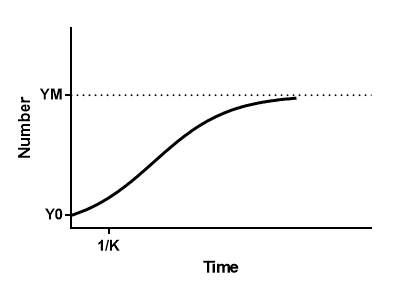
Logistic growth starts off nearly exponential, and then slows as it reaches the maximum possible population.
The logistic model is defined by a linear decrease of the relative growth rate. At any given time, the growth rate is proportional to Y(1-Y/YM), where Y is the current population size and YM is the maximum possible size. As Y approaches the maximum, that second term gets smaller so the growth slows.
Gompertz and logistic models generate curves that are very similar. But when Y is low, the Gompertz model grows more quickly than the logistic model. Conversely, when Y is large, the Gompertz model grows more slowly than the logistic model.
Step by step
Create an XY table. Enter time values into X and population values into Y. After entering data, click Analyze, choose nonlinear regression, choose the panel of growth equations, and choose Logistic growth.
Consider whether you want to constrain Y0 and/or Ym to fixed values.
Model
Y=YM*Y0/((YM-Y0)*exp(-k*x) +Y0)
Interpret the parameters
Y0 is the starting population (same units as Y)
YM is the maximum population (same units as Y)
k is the rate constant (inverse units of X)
1/k is the X coordinate of the first inflection point