Prism is not designed to analyze any particular kind of assay
Prism is a very general program, used by scientists in many fields. It is easy for you to interpolate standard curves using Prism, but you must make some decisions. Unlike some specialized programs, Prism is not set up so you can blindly enter data and get results without thinking.
Entering data for interpolation
Enter the standard curve (also inown as a calibration curve) in the top rows of a table, and then enter the unknown values right below those standards. In most cases, as shown below, you'll enter Y values and leave X blank. Prism can also interpolate the other way. In this case, enter X values and leave Y blank.
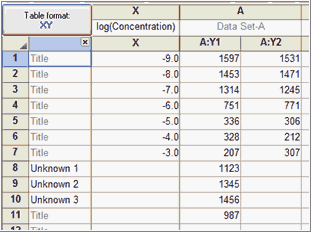
Entering labels for the unknowns, as shown below, is optional.
Note that it is essential that the unknowns go below the standard curve values. If you place the unknowns above the standard curve, Prism will not interpolate. Of course, the unknown Y values must be in the same units as the Y values you entered for the standard curve.
Fitting a standard curve and interpolating
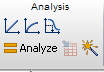
Four analyses in Prism let you interpolate values from curves. The top row of buttons in the analysis block provide shortcuts to linear regression, nonlinlear regression, and the simplified analysis for interpolating a standard curve.
Interpolate a standard curve
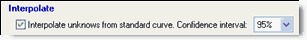
This analysis (new to Prism 6) is a simple way to interpolate using nonlinear regression.
The choices on the dialog are simple. Choose a model to fit to your data. The most commonly used models for standard curves are shown in the dialog. Next choose how to handle outliers. You can choose to use robust regression, so outliers have little impact. Or you can ask Prism to identify, and perhaps eliminate, outliers using the ROUT method. Finally, if the scatter among replicates is larger when the Y values are larger, consider using relative weighting.
Note that this simplified analysis to interpolate is simply a subset of the nonlinear regression analysis, with fewer choices on the dialog. If you want to select options that aren't available, click the "More.." button at the bottom of the dialog to convert the analysis to the full nonlinear regression analysis, with many more options (six tabs worth). Once you switch to nonlinear regression analysis, it is not possible to switch back (except by starting over).
Nonlinear regression
Nonlinear regression offers the interpolation option at the bottom of the first (Model) tab of the dialog. This is a good choice if you want to use options not available on the simpler interpolation analysis.
Simple Linear regression
Simple linear regression offers a checkbox to interpolate the top of the dialog.
Spline
Prism can also interpolate from a standard curve in the spline analysis. Splines go through every point. The advantage of a spline is that you don't have to choose a model to fit to your data. The disadvantage is that the curve may wiggle too much.
An alternative approach to interpolating one value
If you enter your own (user-defined) equation, or clone an existing one, you can specify that Prism report the value of Y at a particular X, or the X value at a particular Y.