Do not ignore the confidence intervals
In most cases, the entire point of nonlinear regression is to determine the best-fit values of the parameters in the model. The confidence interval tells you how tightly you have determined these values. If a confidence interval is very wide, your data don't define that parameter very well. Confidence intervals are computed from the standard errors of the parameters.
How accurate are the standard errors and confidence intervals?
Prism gives you two choices in the Confidence tab.
The asymptotic or approximate standard errors reported by Prism (and virtually all other nonlinear regression programs) are based on some mathematical simplifications. They are calculated assuming that the equation is linear, but are applied to nonlinear equations. This simplification means that the intervals can be too optimistic.
Prism also lets you choose to report asymmetrical confidence intervals (profile likelihood intervals) and these are more accurate but take longer to calculate.
Sometimes Prism reports "very wide" instead of reporting the confidence interval
If you see the phrase 'very wide' instead of a confidence interval, you may also see the phrase 'ambiguous' at the top of the results tables. This means that the data do not unambiguously define the parameters. Many sets of parameters generate curves that fit the data equally well. The curve may fit well, making it useful artistically or to interpolate unknowns, but you can't rely on the best-fit parameter values. Alternatively, depending on the options selected on the Confidence tab, you may also see specific parameters identified as being "unstable". Learn more about unstable parameters here.
When does Prism report "infinity" as a confidence limit?
Prism reports that the upper confidence limit is infinity when the model and data simply don't define the upper confidence limit. If you are aiming for 95% confidence limits, Prism will report that the limit is infinite when the confidence level is less than 95% no matter how large the algorithm sets that confidence limit.
Similarly, Prism reports -infinity when the model and data simply don't define the lower confidence limit.
When you see that a confidence limit is infinity (or -infinity), you can conclude that your data simply don't define that parameter in the model very well. One example would be if you are fitting an asymmetrical ("five parameter") log(dose)-response curve, and the confidence limit for the asymmetry parameter is infinity. This can happen when your data form a symmetrical log(dose)-response curve, so there is no information in the data to define the asymmetry parameter.
When does Prism report "???" as a confidence limit?
Prism reports ??? for a confidence limit when its calculations got interrupted, so it was unable to compute the limit. Changes in Prism 8 make this happen less often than it did with Prism 7.
Why would the calculations get interrupted? There are several reasons.
•It is conceivable that the problem is due to the data being super huge or really tiny values. If all your data look something like 1.23e-45 or 1.23e45 try transforming to different units so the values are not so incredibly large or small. It is possible that this might be helpful and let Prism fine the confidence limits.
• Prism reports ??? when the model equation is fundamentally difficult to fit, and when the data simply don't define the model very well. This could be because of too few values, no values at important ranges of X values, too much scatter, etc. Even though Prism can't explain why it reports ???, you can conclude that there is no way to compute a reasonable short useful confidence interval given those data and that model.
Confidence intervals of transformed parameters
In addition to reporting the confidence intervals of each parameter in the model, Prism can also report confidence intervals for transforms of those parameters. For example, when you fit an exponential model to determine the rate constant, Prism also fits the time constant tau, which is the reciprocal of the rate constant.
When you write your own equation, or clone an existing one, choose between two ways to compute the confidence interval of each transformed parameter. If you pick a built-in equation, Prism always reports asymmetrical confidence intervals of transformed parameters.
Do not mix up confidence intervals and confidence bands
It is easy to mix up confidence intervals and confidence bands. Choose both on the Confidence tab.
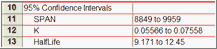
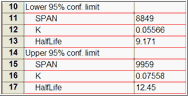
The 95% confidence interval tells you how precisely Prism has found the best-fit value of a particular parameter. It is a range of values, centered on the best-fit value. Prism can display this range in two formats:
|
|
The 95% confidence bands enclose the area that you can be 95% sure contains the true curve. It gives you a visual sense of how well your data define the best-fit curve. It is closely related to the 95% prediction bands , which enclose the area that you expect to enclose 95% of future data points. This includes both the uncertainty in the true position of the curve (enclosed by the confidence bands), and also accounts for scatter of data around the curve. Therefore, prediction bands are always wider than confidence bands.