Before fitting a log(dose) vs. response curve, it is common to first normalize the data. This page explains why one should not use weighted regression in this situation.
Weighted fits to nonnormalized data -- works great
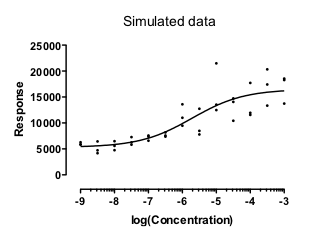
The graph below shows simulated data that show a common situation. The scatter among replicates is greater when the Y values are greater. In fact, these data were simulated so the SD among replicates is proportional to the Y value.
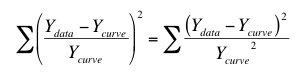
These data fit nicely using relative weighting. This minimizes the sum of the squares of the relative distance between the points and the curve. In other words it minimizes:
I ran 10,000 simulations, and found that in every case the fit worked well and gave a reasonable answer (with the EC50 within the range of the data). No surprise so far. The data were fitting assuming a model that exactly matched the method used to simulate the data, and those fits worked well.
Weighted fits to normalized data -- ugh
People often like to normalize dose-response data so the Y values range from 0% to 100%. What happens if these normalized data are fit with weighted nonlinear regression?
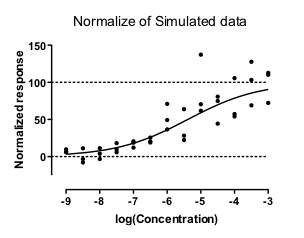
I answered that question with simulations. Of 1,000 simulated data sets, 223 could not be fit at all. Moreover, 60 simulated data sets gave nonsense results, with the EC50 outside of the range of the data. The remaining 72% of the simulations seemed ok, but the confidence intervals were very wide in some.
What's going on?
With the data that were not normalized, the Y value of the best-fit curve at X = -4 is 3.05 times larger than the Y value of the curve at X=-8. Since the weighting is proportional the the Y value of the curve squared, the points near the top of the curve (at X=-4) get 3.052 , or 9.28, times as much weight as points near the bottom of the curve (at X=-8).
The situation is very different with the normalized data. With the first simulated data set, the Y value of the best-fit curve at X = -4 is 17.77 times larger than the Y value of the curve at X=-8. Since the weighting is proportional the the Y value of the curve squared, the points near the top of the curve (at X=-4) get 17.772 , or 315.8, times as much weight as points near the bottom of the curve (at X=-8). Since the points at the top of the curve gets so much more weight that those at the bottom, those at the bottom are essentially ignored, making the entire curve fit not work very well.
Another problem. Some of the Y values near the bottom of the normalized data sets are negative. Weighting factors really don't make any sense at all when some values are negative and some are positive.
In summary: After normalizing the SD among replicates is no longer proportional to the Y values, so relative weighting is not appropriate.
Bottom line
The whole idea of weighted nonlinear regression is to match the weighting scheme used by the regression to the variation in the actual data. If you normalize the data, none of the usual weighting schemes will work well.
If you really want to show your data on a normalized axis running from 0% to 100%, you can do so. First fit the model to the actual data using an appropriate weighting scheme. Then normalize both the data and the curve.
Details and link to Prism file