The 95% confidence interval of the EC50 is not symmetrical
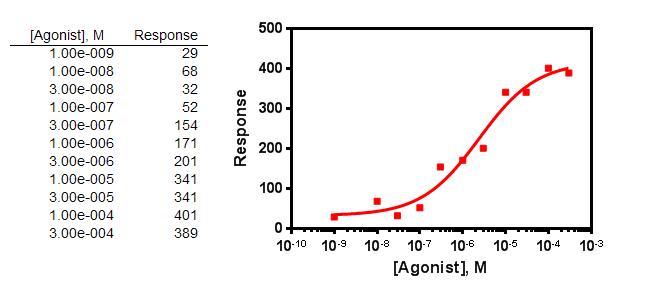
Sample data
Asymmetrical confidence intervals
The sample data above were fit to the model: [Agonist] vs. response -- variable slope with the Confidence tab set to compute confidence intervals using the asymmetrical (likelihood) method which we recommend. The best fit value of the EC50 (multiplied by 106 to convert to micromolar) is 2.4 μM with the 95% confidence interval ranging from 0.85 μM to 15.3 μM.
Prism also reports these values on a log scale. The logEC50 (log molar) is -5.62 with a 95% confidence interval ranging from -6.07 to -4.82.
Three things to notice:
•The confidence interval is fairly wide. This is because the data have some scatter and also because we are fitting the EC50 plus three other parameters (the top and bottom plateaus and the slope). If you fix one or more of those parameters to constant values, the confidence interval for the EC50 would get narrower.
•The confidence interval, expressed on a concentration scale, is quite asymmetrical.
•The confidence interval, expressed on a log scale, is close to symmetrical.
An alternative way to fit the data are to transform the X values to their logarithm, and then fit the results of this transform to the model: log[Agonist] vs. response -- variable slope with the Confidence tab set to compute confidence intervals using the asymmetrical (likelihood) method which we recommend using always. You'll get exactly the same results this way.
Symmetrical confidence intervals
Prism offers two methods to compute the confidence intervals. The results above were computed using the new method that produces asymmetrical intervals. If you use other method (the only method offered in prior versions of Prism), the confidence intervals for the parameter you fit are always symmetrical.
If you fit the model that fits the logEC50, the confidence interval ranges from -6.07 to -4.82. The "asymmetrical" confidence interval of the logEC50 shown above is nearly symmetrical, so the symmetrical confidence interval is nearly the same (is the same to three digits).
But what if you fit the EC50 and ask for symmetrical confidence interval. In this case the reported interval ranges from 0 μM to 5.21μM. This seems asymmetrical because the EC50 is contrained to be greater than zero. If you removed that constraint, Prism would report a confidence interval ranging from -0.42 μM to 5.21μM, which is symmetrical around the best-fit value of 2.4 μM. This symmetrical interval does a really poor job of quantifying the precision of the IC50. The simple fact is that the uncertainty is asymmetrical, and a symmetrical interval can be very misleading. Even setting aside the negative portion of the confidence interval, it includes all values from zero on up, so doesn't provide any guidance about how low the EC50 might really be. That is why we recommend that you choose asymmetrical intervals routinely.
Do not transform the standard error of the logEC50
We suggest that you always ask Prism to report the asymmetrical confidence intervals, and not to report the standard error of the parameters. The SE of the parameters does a poor job of quantifying precision. It gets particularly confusing when logarithms get involved. When some people see the SE of the logEC50, they are tempted to convert this to the standard error of the EC50 by taking the antilog. This is invalid.
In the example, the SE of the logEC50 is 0.2158. The antilog of 0.2158 equals 1.644. This value is not the SE of the EC50. It cannot be interpreted as a plus/minus error value. It is a times/divided by error value. To get an equivalent to the logEC50 plus or minus one of the logEC50, find the lower limit by dividing the EC50 by 1.644 and the upper limit by multiplying by 1.644. But this is not commonly done, so it would be confusing if you tried to report results this way.
Averaging the EC50 from several experiments
The uncertainty is close to symmetrical when you express the midpoint of a dose-response curve as a logEC50, but is usually far from symmetrical when you express it as the EC50. When pooling several experiments, therefore, it is best to average the logEC50 values, which will give a different result than averaging the EC50 values.