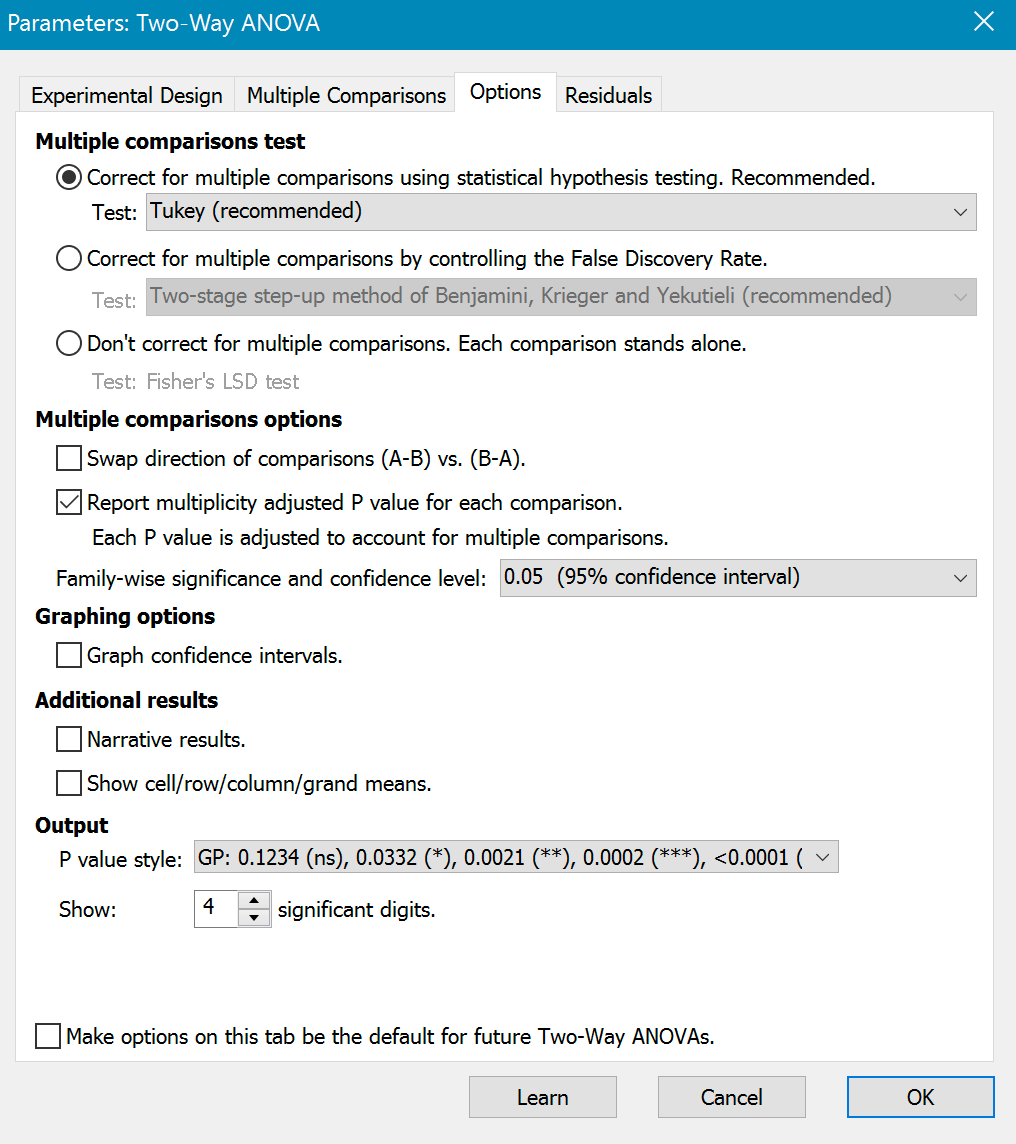
Correct for multiple comparisons using statistical hypothesis testing
Some of these methods let you compute confidence intervals and multiplicity adjusted P values, and some don't. We recommend one of the tests that compute confidence intervals and multiplicity adjusted P values for two reasons:
•Confidence intervals are much easier for most to interpret than statements about statistical significance.
•Multiplicity adjusted P values provide more information that simply knowing if a difference has been deemed statistically significant or not.
Recommended methods
The list of tests available depends on the goal you specified on the second tab. We recommend these tests because they can compute confidence intervals and multiplicity adjusted P values
•If you are comparing every row (or column) mean with every other row (or column) mean, we recommend the Tukey test.
•If you are comparing a control row (or column) mean with the other row (or column) means, we suggest the Dunnett's test.
•If you are comparing a bunch of independent comparisons, we recommend the Sidak method, which is very similar to Bonferroni but has a tiny bit more power.
Other available methods
The Bonferroni and Sidak methods are offered for compatibility with other programs, but we see no advantages from choosing these tests.
If you don't care about seeing and reporting confidence intervals, you can gain a bit more power by choosing the Holm-Šídák test. It is is more powerful than the Tukey method for comparing all pairs of means (3). That means that with some data sets, the Holm-Šídák method can find a statistically significant difference where the Tukey method cannot. Glantz says that Holm's test ought to have more power than Dunnett's test, but this has not (to his knowledge) been explored in depth(2)
Prism also offers the Newman-Keuls test (when comparing each mean with each other mean) for historical reasons (so files made with old versions of Prism will open) but we suggest you avoid it because it does not maintain the family-wise error rate at the specified level(1). In some cases, the chance of a Type I error can be greater than the alpha level you specified.
Correct for multiple comparisons by controlling the False Discovery Rate
Prism offers three methods to control the false discovery rate. All decide which (if any) comparisons to label as "discoveries" and do so in a way that controls the false discovery rate to be less than a value Q you enter.
The FDR approach is not often used as a followup test to ANOVA, but there is no good reason for that.
Don't correct for multiple comparisons. Each comparison stands alone.
If you choose this approach, Prism will perform Fisher's Least Significant Difference (LSD) test.
This approach (Fisher's LSD) has much more power to detect differences. But it is more likely to falsely conclude that a difference is statistically significant. When you correct for multiple comparisons (which Fisher's LSD does not do), the significance threshold (usually 5% or 0.05) applies to the entire family of comparisons. With Fisher's LSD, that threshold applies separately to each comparison.
Only use the Fisher's LSD approach if you have a very good reason, and are careful to explain what you did when you report the results.
Multiple comparisons options
Swap direction of comparisons
The only affect of this option is to change the sign of all reported differences between means. A difference of 2.3 will be -2.3 if the option is checked. A difference of -3.4 will be 3.4 if you check the option. It is purely a personal preference that depends on how you think about the data.
Report multiplicity adjusted P value for each comparison
If you choose the Bonferroni, Tukey or Dunnett multiple comparisons test, Prism can also report multiplicity adjusted P values. If you check this option, Prism reports an adjusted P value for each comparison. These calculations take into account not only the two groups being compared, but the total number groups (data set columns) in the ANOVA, and the data in all the groups.
The multiplicity adjusted P value is the smallest significance threshold (alpha) for the entire family of comparisons at which a particular comparison would be (just barely) declared to be "statistically significant".
Until recently, multiplicity adjusted P values have not been commonly reported. If you choose to ask Prism to compute these values, take the time to be sure you understand what they mean. If you include these values in publications or presentations, be sure to explain what they are.
Confidence and significance level (or desired FDR)
By tradition, confidence intervals are computed for 95% confidence and statistical significance is defined using an alpha of 0.05. Prism lets you choose other values. If you choose to control the FDR, select a value for Q (in percent). If you set Q to 5%, you expect up to 5% of the "discoveries" to be false positives.
References
1.SA Glantz, Primer of Biostatistics, sixth edition, ISBN= 978-0071435093.
2.MA Seaman, JR Levin and RC Serlin, Psychological Bulletin 110:577-586, 1991.