Big picture
Two-way ANOVA requires replication to do a sensible analysis. Before discussing the problem of ANOVA without replication, lets consider an example with replication (so no issue).

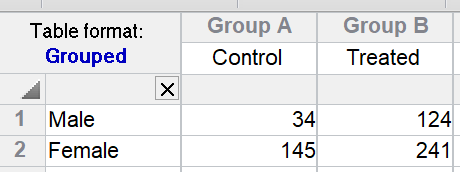
The two values in side-by-side subcolumns are results from different animals. There are eight values so eight animals. Prism tests whether the effect of the treatment is the same in both genders -- whether there is an interaction. The P value for this example is quite high, so there is no evidence of interaction. The ANOVA table (not shown here) shows that Prism is able to separately compute the sum-of-squares for interaction and the sum-of-squares between replicate animals (residual variation).

There are two situations where lack of replication is a problem.
Problem 1. No replication. Only one value for each set of conditions.
If you only have one value for each row/column cell, Prism cannot test for interaction so assumes there is none. For the example, this assumption is that the effect of treatment is the same in males and females. The P values are tiny for both the effects of Gender and the effect of Treatment.
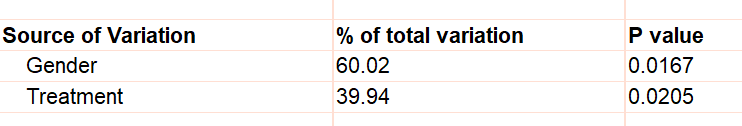
But what if the treatment really didn't work in females and the only value for treated females (241) value is high simply because that particular animal is an outlier? If that were true, there would have been an interaction -- the treatment would have worked better in one gender than the other. With only a single value in each cell, Prism can't test for this, and assumes no interaction.
The assumption of no interaction may or may not be a reasonable assumption for your situation. It is far better to include replication in your experimental design so Prism can test for interaction.
Problem 2. Pseudo-replication
This second problem is a bigger problem, because ANOVA gives results that can be misleading.
Given the same experimental goals as before, we'll do the experiment a bit differently using a different experimental design. We'll use only one animal for each row/column combination, and measure the response twice in each animal. Note there are only four animals tested in total. but there are eight values because each animal is measured twice. The data look exactly like the data on the top of the page with eight animals.
There are no data to assess animal-to-animal variation, so it is impossible to distinguish variation among animals from variation due to interaction. Accordingly, this is a poor experimental design.
There are three approaches to analyzing such data:
Assume no variation among animals (what Prism does)
When you analyze these data in Prism with two-way ANOVA, Prism is mixed up. It does the full ANOVA, so reports the same results shown above for the data from eight animals. It assumes that the variation between duplicate values tells you about variation among animals. It can't tell if the variation seen between treatment combinations is due to differences between animals or the effects of the treatment.
For example, the two values for treated females could be large because that one animal is a bit different than the others, quite apart from the effect of treatment. So the results only make sense if you assume that the variation seen in the duplicate measurements is the same as the variation between animals. Be aware, however, that when your experiment contains pseudo-replicates, this assumption often is not valid.
Assume no interaction and ignore pseudo replication (Prism can do with an extra step)
The second approach is to assume there is no interaction and therefore all variation not due to row and column effects is due to differences among animals. Prism doesn't offer this option directly, but you can run this analysis by following these steps:
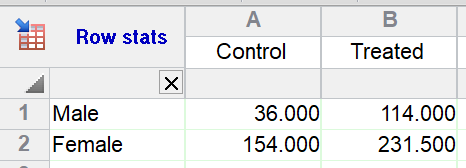
1.Run the analysis: Row means with SD or SEM.
2.Choose to only compute the mean, without error bars.
3.From the resulting table, run two-way ANOVA.

Since there is no replication in the data table being analyzed, Prism assumes no interaction.
With this example, the two ways of analyzing the data give similar results. But with other examples, the results could be quite different. The two approaches use very different assumptions, so it is worth thinking through carefully.
Assume no interaction and fit a mixed effects model that accounts for pseudo replication (not available in Prism)
The best way to analyze these data would be to fit a mixed model that assumes no interaction but properly accounts for the replicated measurements in each animal. This approach is preferred because it analyzes all the data without making extra assumptions. However, Prism does not offer this analysis.