If you entered XY data, with values in the X column, you can make a Grouped graph. But note:
The whole point of a grouped graph, is that the X axis is spaced by row number. The X value does not determine the position of the points on the graph. This can be useful in some situations, but very misleading in others. As shown below, the X values may not even be plotted in order of their value. On a grouped graph, position is determined by row number only.
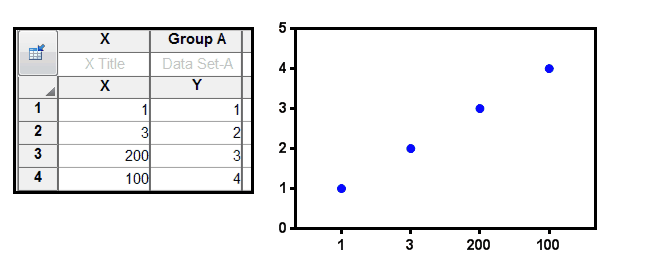
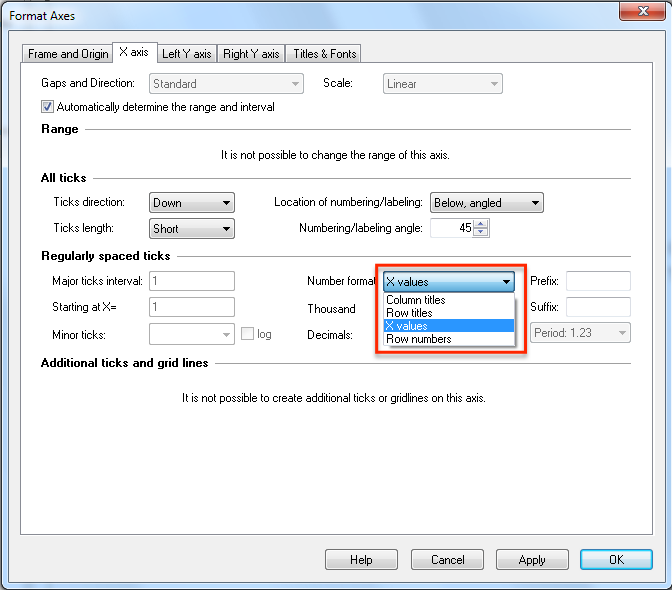
The graph above has the X axis labeled with the X values. On the Format Axes dialog, you can choose to use Row titles (if you entered any), row numbers or column titles instead.