How do you change the grouping and spacing of bars on Grouped graphs?
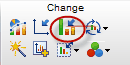
Click on the Format graph button on the Prism toolbar or double-click on any data point to open the Format Graph dialog.
Set the standard spacing between data sets
To change the standard spacing between individual bars and groups of bars, go to the Graph Settings tab.
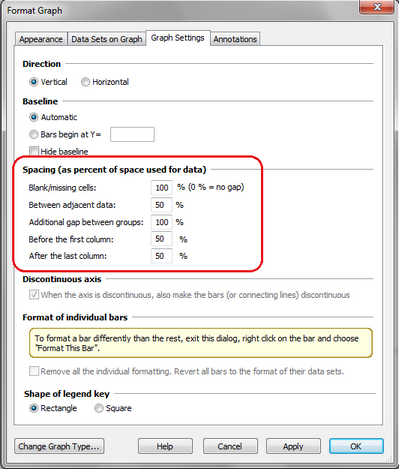
Use these settings to set adjust the spacing between columns on a graph, between groups of columns, and before the first column and after the last one. If you make the spacing smaller, the columns will become wider.

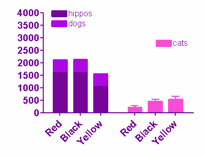
Choose how much if any space to leave for the bar where no value was entered (the cell is blank). In the example below, no data was entered for black dogs. You can choose to leave no space, normal 100% space, or something in between.
Note a possible point of confusion. The percentages set in this tab of the dialog specify spacing as percent of the "normal" width. The normal width is set in the by the number of data sets, number of rows and width of the graph.
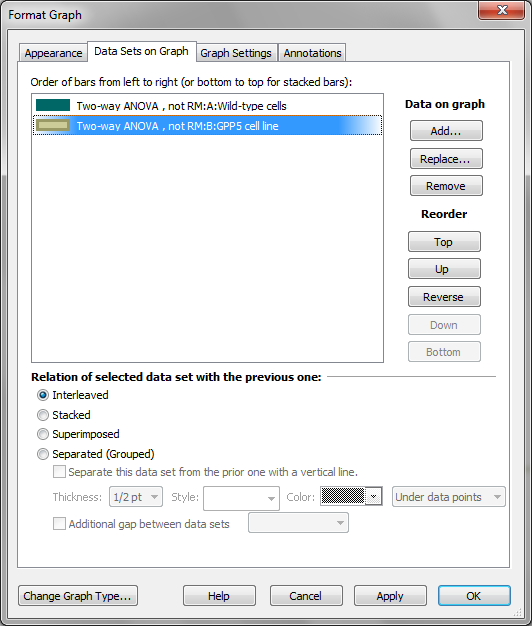
Set how you want the bars to be grouped
You can change the overall grouping scheme of a graph or make hybrid graphs types using the order tab of the Format Graph dialog. For each data set, choose whether it should be interleaved with, stacked on top of, placed apart from the (starting a new group of bars, hence the name “grouped”) or superimposed on the preceding data set.
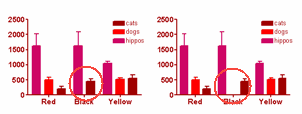
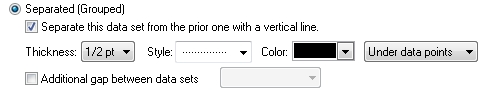
Add lines between groups
Check the box to Separate a data set from another with a line.

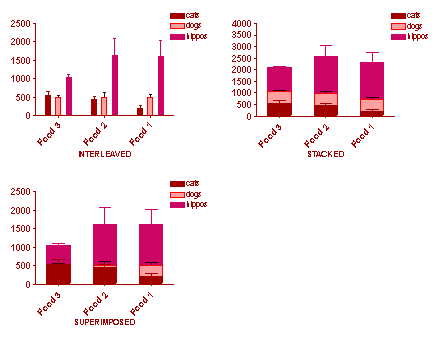
Stacked and superimposed bars
Note the difference between Stacked and Superimposed below. When the bars are superimposed, each extends from the X axis to the value. When bars are stacked, each bar starts at the top of the one below.
Notes:
•Semitransparent color are not helpful with superimposed bar graphs. Prism actually plots these as stacked bars (doing the subtraction to know how big to make each slice). So you won't see the color of the bars further back showing through the bars in front. Don't try to use semitransparent colors with superimposed bars.
•Use the second tab of Format Graph to change the order of data sets, which controls which data set is on top.
•With stacked bars, each row in the data table becomes one stack of bars. If you want to leave a gap between stacks (to create a natural grouping of sets of stacked bars), leave a blank row in your data table.
•It sometimes is helpful to combine both stacked and interleaved bars on the same graph as below. This is done by checking the option to stack the "dogs" data set on top of hippos, and to make the "cats" data set grouped.