Prism 8 offers a new kind of data table for nested data where values stacked in each subcolumn are related, and creates subcolumn graphs of these data. In this example, there are two treatments given to three rats each and the outcome variable was measured four times in each rat.
|
|
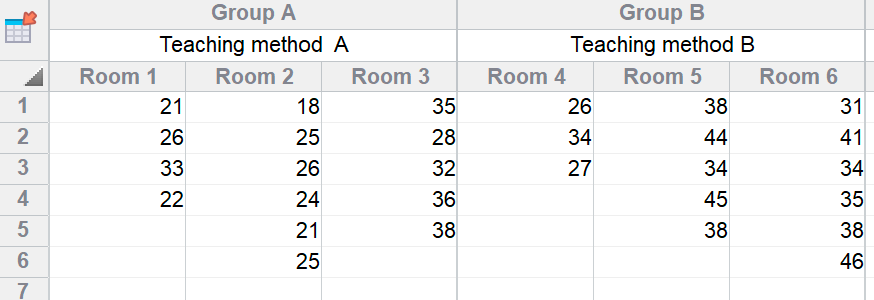

The different rats (different subcolumns) are actual replicates in the experiment, while the multiple measurements (different rows) are technical replicates. If you combined these and entered twelve replicates for each group into a t test, the results would be wrong. This is the error of pseudoreplication.
With two treatments (as in the example above), Prism 8 analyzes these data with what we are calling a nested t test. With three or more groups, Prism 8 offers the nested one-way ANOVA.
Note that "nested t test" and "nested one-way ANOVA" are not (yet!) standard terms. Prism actually runs the appropriate mixed-effects model, and this works even different subcolumns have different number of values, or different treatments have data in different number of subcolumns.