The format of a Prism data table determines what kinds of graphs you can make and what kind of analyses you can perform. Choosing a data table format lets Prism create a data table that fits your data and makes it easy to create the kind of graph you want and perform the appropriate analyses. You can always change the format of a data table.
The eight kinds of data tables
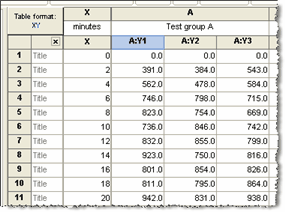
XY tables - An XY table is a graph where every point is defined by both an X and a Y value. This kind of data are often fit with linear or nonlinear regression.
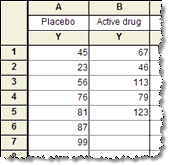
Column tables - Use column tables if your groups are defined by one scheme, perhaps control vs. treated, or placebo vs. low-dose vs. high-dose. Each column defines one group.
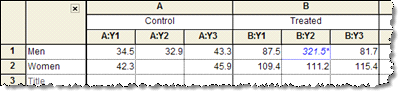
Grouped tables - The idea of two-way variables is best understood by example. One grouping variable (male vs. female in the example below) is defined by rows; the other grouping variable (control vs. treated) is defined by columns.
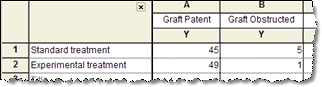
Contingency tables - Contingency tables are used to tabulate the actual number of subjects (or observations) that fall into the categories defined by the rows and columns of a table.
Survival tables - Survival tables are used to enter information for each subject. Prism then computes percent survival at each time, and plots a Kaplan-Meier survival plot (and also compares survival with the log-rank and Gehan-Wilcoxon tests).

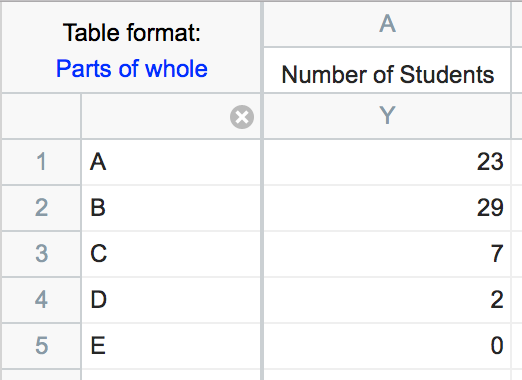
Parts of whole tables - A Parts of whole table is used when it makes sense to ask: What fraction of the total is each value? This table is often used to make a pie chart. The example below shows the number of students who received grades of A, B, C, etc. The sum of the five values in the table (61) is the total number of students.
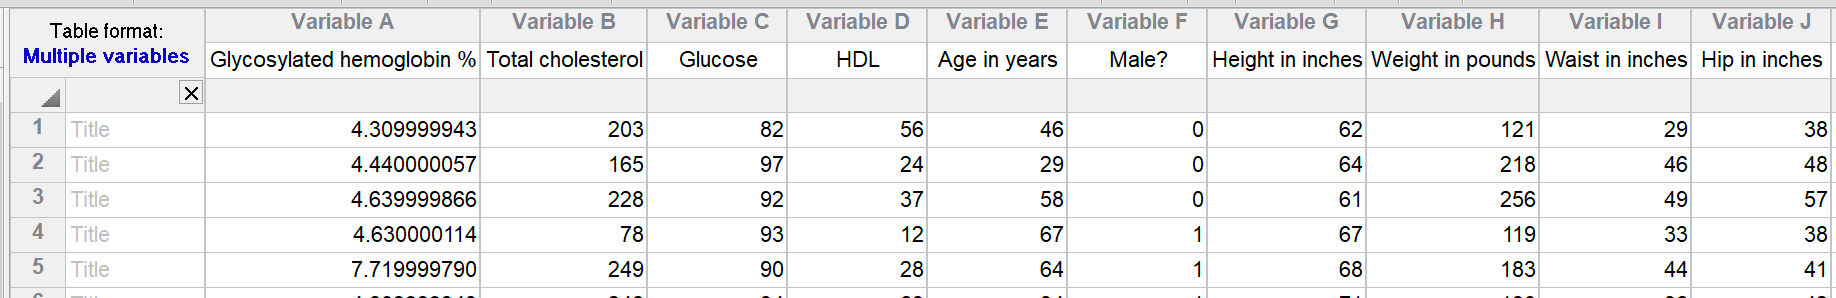
Multiple variable tables. A multiple variable table is arranged the same way most statistics programs organize data. Each row is a "case" (experiment, animal, etc.). Each column is a different variable. There are no subcolumns in multiple variable tables.
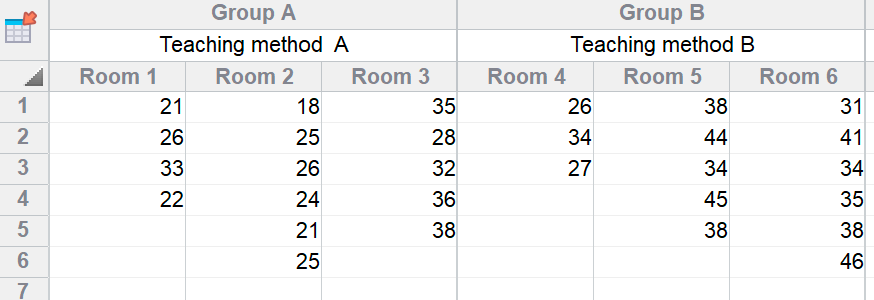
Nested tables. A nested table is used when there are two levels of nested or hierarchical replication. In this example, there are two treatments given to three rats each and the outcome variable was measured four times in each rat.