The final graph produced by PCA is the Proportion of variance plot. As discussed in the section discussing methods for PC selection, the proportion of variance explained by any given principal component can be calculated as:
% Variance explained = [(Eigenvalue of PC)/(Sum of all Eigenvalues)]*100
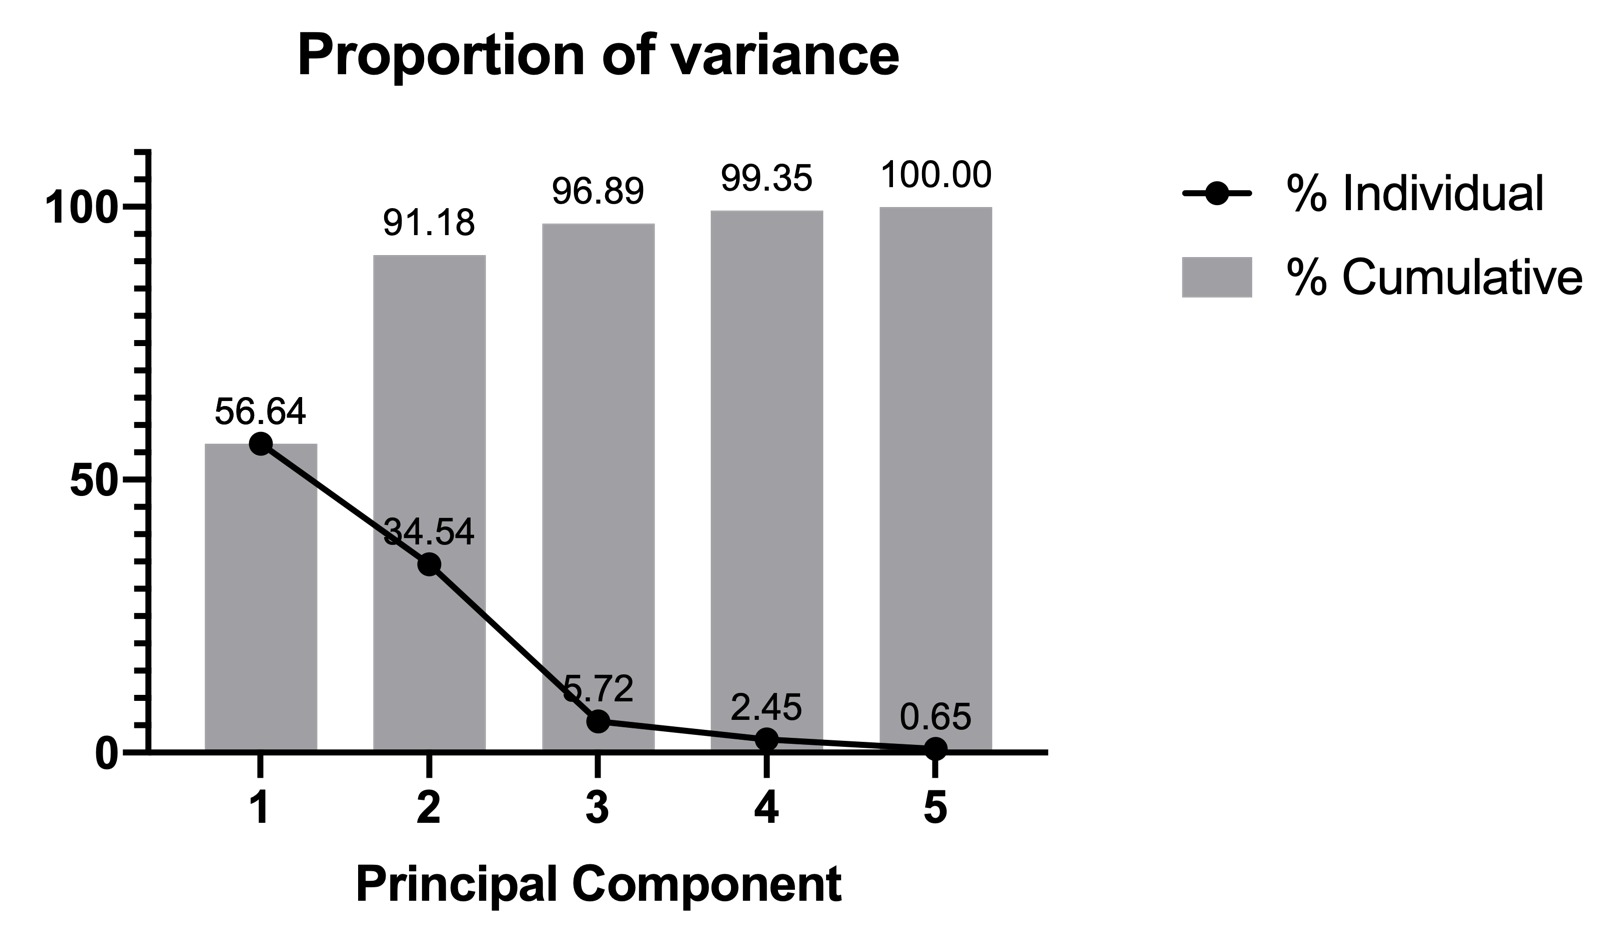
Thus, proportion of variance is just a normalized version of the eigenvalues. As such, the shape of the curve on the proportion of variance plot will be the same as that of the Eigenvalues (Scree) plot. This curve displays the specific proportion of the total variance explained by each PC, while the bars of this plot present the cumulative variance explained by the PC and all PCs before it.
In this example, we used Parallel analysis as the PC selection method. However, if we chose to select PCs based on a threshold for cumulative variance, this would have been displayed on this graph as a horizontal line at the specified threshold. Below, we can see that from only the first two PCs, over 90% of the variance in the data is explained. Over 95% of the variance in the data can be explained by 3 PCs, and over 99% by four PCs. With all five PCs, 100% of the total variance in the data can be explained (remember: creating PCs does not change the total variance in the data. Selecting a subset of PCs reduces the amount of variance that this subset can explain).