Features and functionality described on this page are available with our new Pro and Enterprise plans. Learn More... |
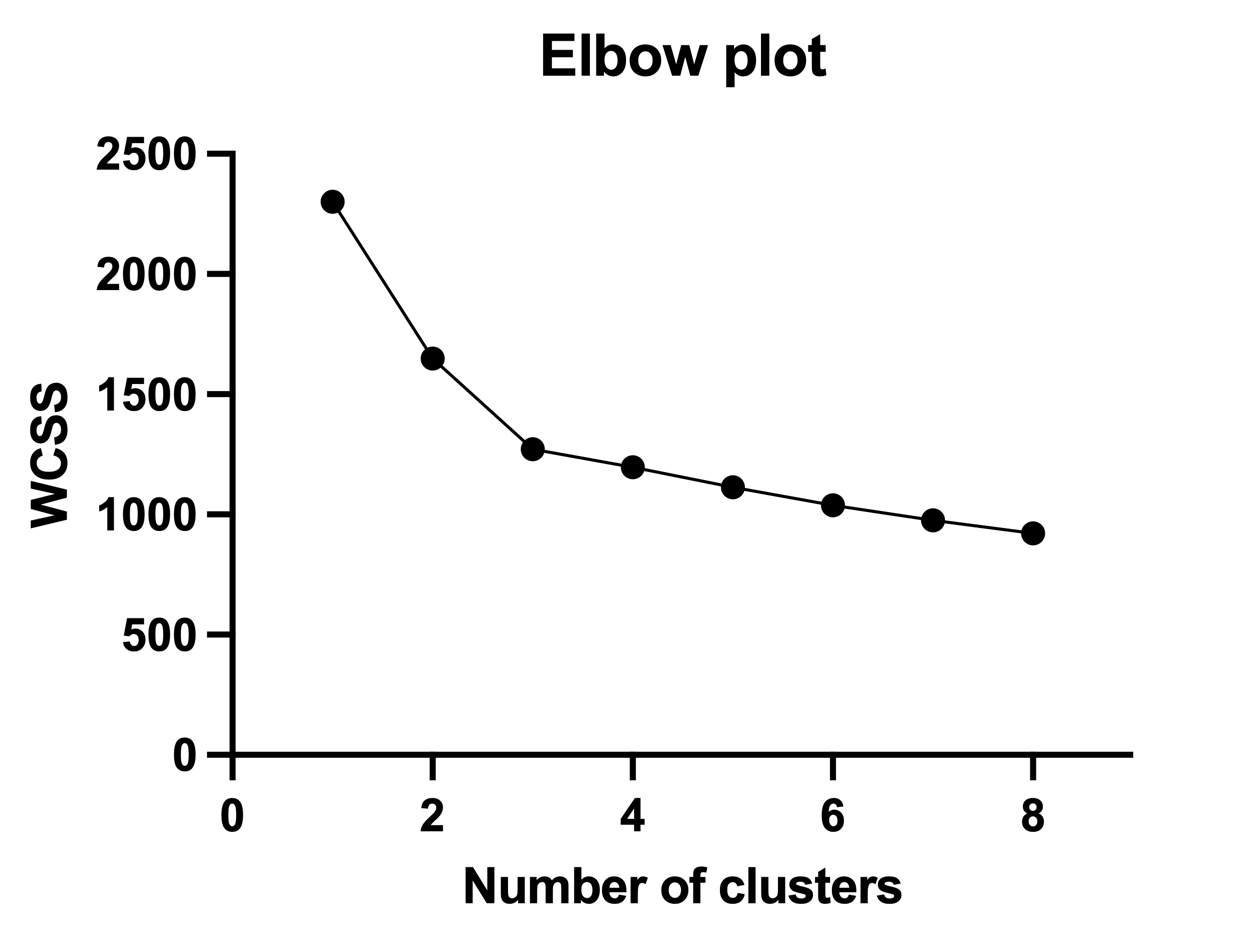
The elbow plot method is one of the oldest techniques (but also one of the simplest to explain) for selecting the optimal number of clusters from a clustering analysis. This method involves creating a plot in which the number of clusters (k) is plotted on the X axis, with a measure of the total variation plotted on the Y axis. The optimal number of clusters is chosen as the point along the resulting curve where the curve starts to “bend” or create an elbow. An example of this sort of graph is shown below:
While there are different measures that can be used to describe the total variation of the clustering, Prism (along with almost all other applications) uses the within-cluster sum of squares (WCSS). To calculate this value:
•Determine the distance between each point in a cluster and its cluster center using the Euclidean distance formula
•Square these distance values
•Determine the sum of the squared distances for each cluster
•Add up the sum of squared distances across all clusters
For a more mathematical definition:

where
•K is the total number of clusters
•Ck is the set of points in cluster k
•xij is the j-th coordinate of the i-th data point in cluster k
•ckj is j-th coordinate of the centroid in cluster k
•n is the number of dimensions (variables) in the data
The WCSS value for a given number of clusters provides a sense of how much variability there is within each of the clusters. A larger value of WCSS indicates that the data within the clusters is more spread out (it has a greater dispersion). Importantly, as you group the same data into more and more clusters, the WCSS generally decreases. The amount of decrease is generally large at first, but then starts to slow as more and more clusters are added. This behavior generates the characteristic “elbow” plot like the one shown above. At some point, adding more clusters no longer dramatically decreases the WCSS of the clustered data, creating a “bend” or “elbow” in the line. It’s at this point where the optimal number of clusters is defined.
The reasoning behind this approach is that any number of clusters after the elbow result in diminished effects of reducing the WCSS (a smaller amount of overall reduction in the amount of dispersion of the data within the clusters). However, being able to select the correct elbow is extremely subjective: there’s no guarantee that two observers would choose the same elbow on the same graph! This happens because elbow plots don’t always exhibit a sharp change in the direction of the line. Because of this, other visual methods such as the silhouette method and the gap method have been developed to try and make the decision a bit more objective. However, in the example graph above, there’s a fairly clear elbow point that occurs when the number of clusters is equal to three. Therefore, using this method would suggest that the optimal number of clusters for this data is three.
Prism also provides the option to utilize a set of 17 methods used in Prism's consensus approach for determining optimal cluster numbers, as described on the cluster metrics page.