Features and functionality described on this page are available with our new Pro and Enterprise plans. Learn More... |
The second method that Prism offers for selecting the optimal number of clusters is through the silhouette score and the silhouette plot. Compared to the Elbow plot method, this method is slightly newer (developed and popularized in the 1980s). Additionally, this method considers the cohesion of each point to other points in its assigned cluster, as well as the separation of each point to all other points in the next nearest cluster. These values of cohesion and separation are then used to determine a silhouette score for each point in the data set. To calculate the silhouette score for a given point:
•Calculate the distance from the point to each other point in its assigned cluster (the "cohesion distance" between two points)
•Calculate the average of these cohesion distances
•Calculate the distance from the point to each point in the next nearest cluster (the "separation distance" between two points)
•Calculate the average of these separation distances
•Subtract the average separation distance from the average cohesion distance
•Divide this difference by the maximum of the cohesion and separation distances
You would then repeat this process for every single point. Once you have scores for each point, average the scores across all points to get a final silhouette score. For each number of clusters that the data are grouped into, you can calculate a different overall silhouette score. The optimal number of clusters is defined as when the overall silhouette score is maximized. Visually, you can plot the overall silhouette score against the number of clusters:
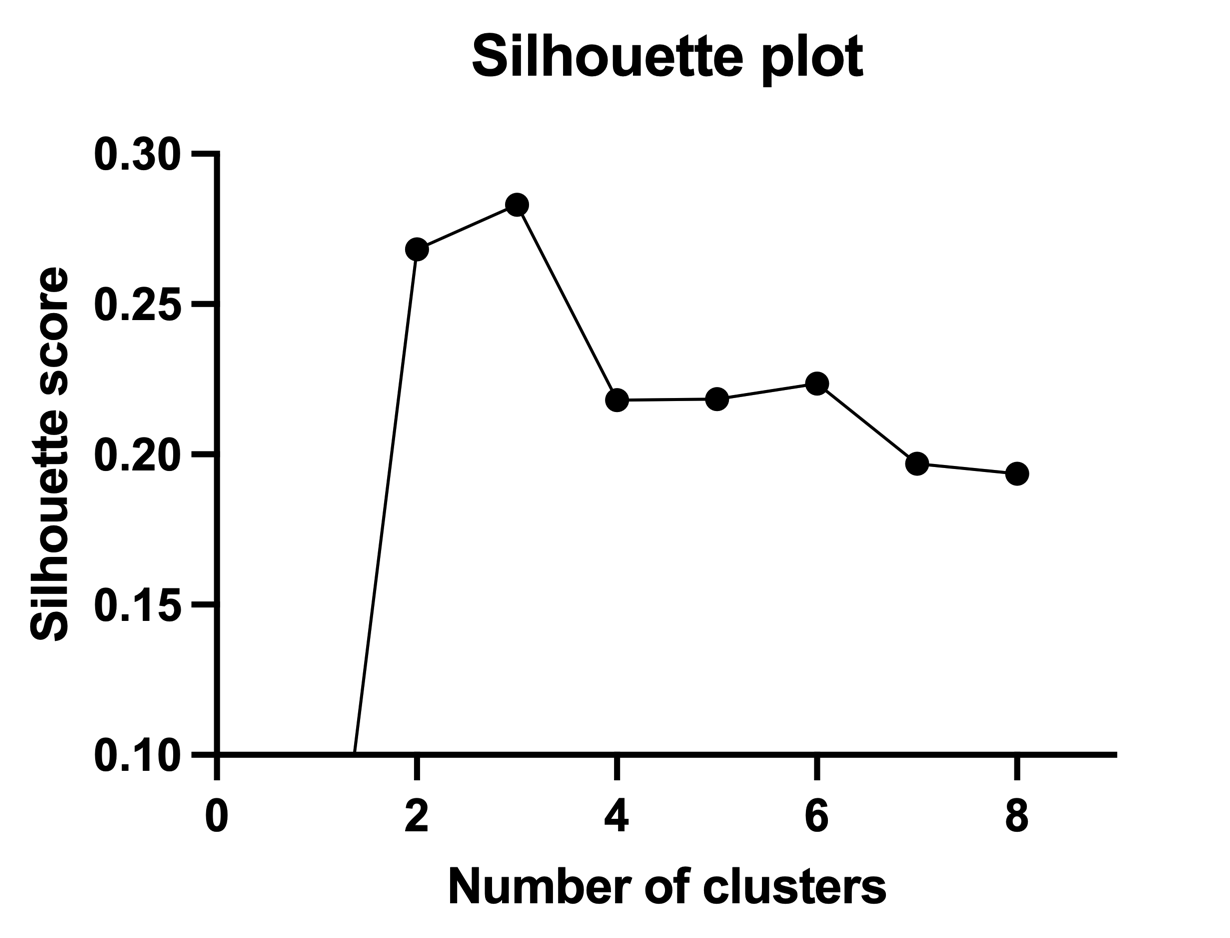
This silhouette plot seems to suggest that three clusters is a reasonable choice for the number of clusters. Note that this graph was generated using the same data as was used for creating the Elbow plot in the previous section which also suggested three clusters as an optimal number to choose.
Mathematically, the silhouette method can be summarized as:

where
•N is the total number of data points
•a(i) is the average distance from point i to all other points in the same cluster
•b(i) is the average distance from point i to all other points in the next nearest cluster
It should also be noted that the silhouette score reported by Prism depends on the distance metric selected in the analysis parameters of the clustering analysis. Because the calculation of cohesion and separation values is dependent on the distance between points, specifying a different distance metric will change how these distances are calculated, and will very likely change the final calculated silhouette score.
Prism also provides the option to utilize a set of 17 methods used in Prism's consensus approach for determining optimal cluster numbers, as described on the cluster metrics page.