In the previous section, we saw that the first principal component (PC) is defined by maximizing the variance of the data projected onto this component. However, with multiple variables (dimensions) in the original data, additional components may need to be added to retain additional information (variance) that the first PC does not sufficiently account for.
How many principal components are possible from the data?
In general, a dataset can be described by the number of variables (columns) and observations (rows) that it contains. The number of variables is typically represented by p (for “predictors”) and the number of observations is typically represented by n.
The number of total possible principal components that can be determined for a dataset is equal to either p or n, whichever is smaller. Two points to keep in mind, however:
•In many datasets, p will be greater than n (more variables than observations). This sort of "wide" data is not a problem for PCA, but can cause problems in other analysis techniques like multiple linear or multiple logistic regression
•It’s rare that you would want to retain all of the total possible principal components (discussed in more detail in the next section)
For the sake of simplicity, we’ll assume that we’re dealing with datasets in which there are more variables than observations (p > n). However, when defining PCs, the process will be the same. After identifying the first PC (the linear combination of variables that maximizes the variance of projected data onto this line), the next PC is defined exactly as the first with the restriction that it must be orthogonal to the previously defined PC.
This is easy to understand in two dimensions: the two PCs must be perpendicular to each other. Let’s go back to our standardized data for Variable A and B again.
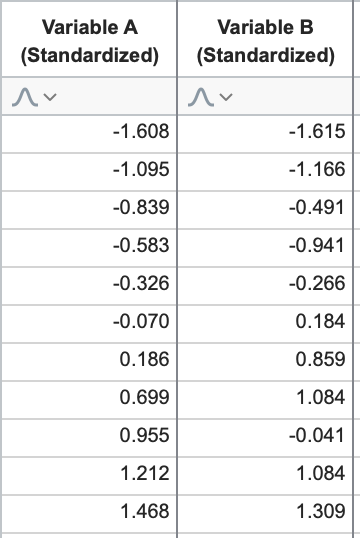
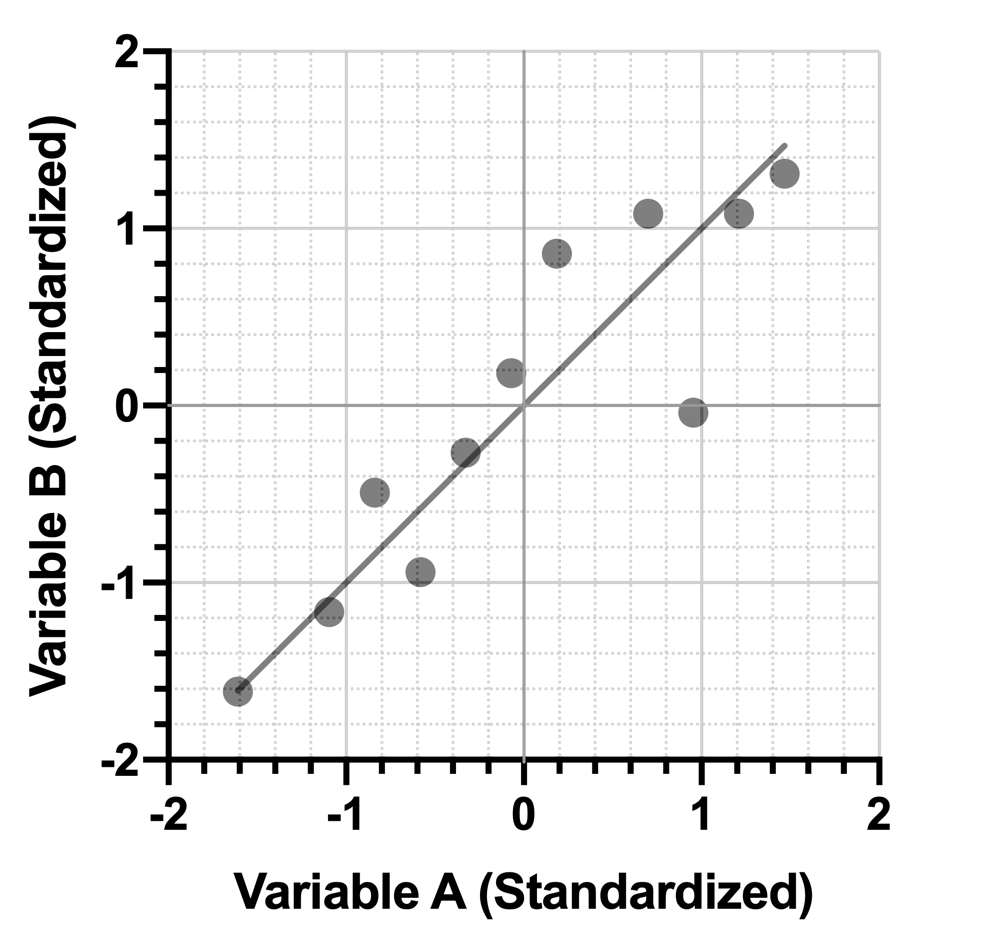
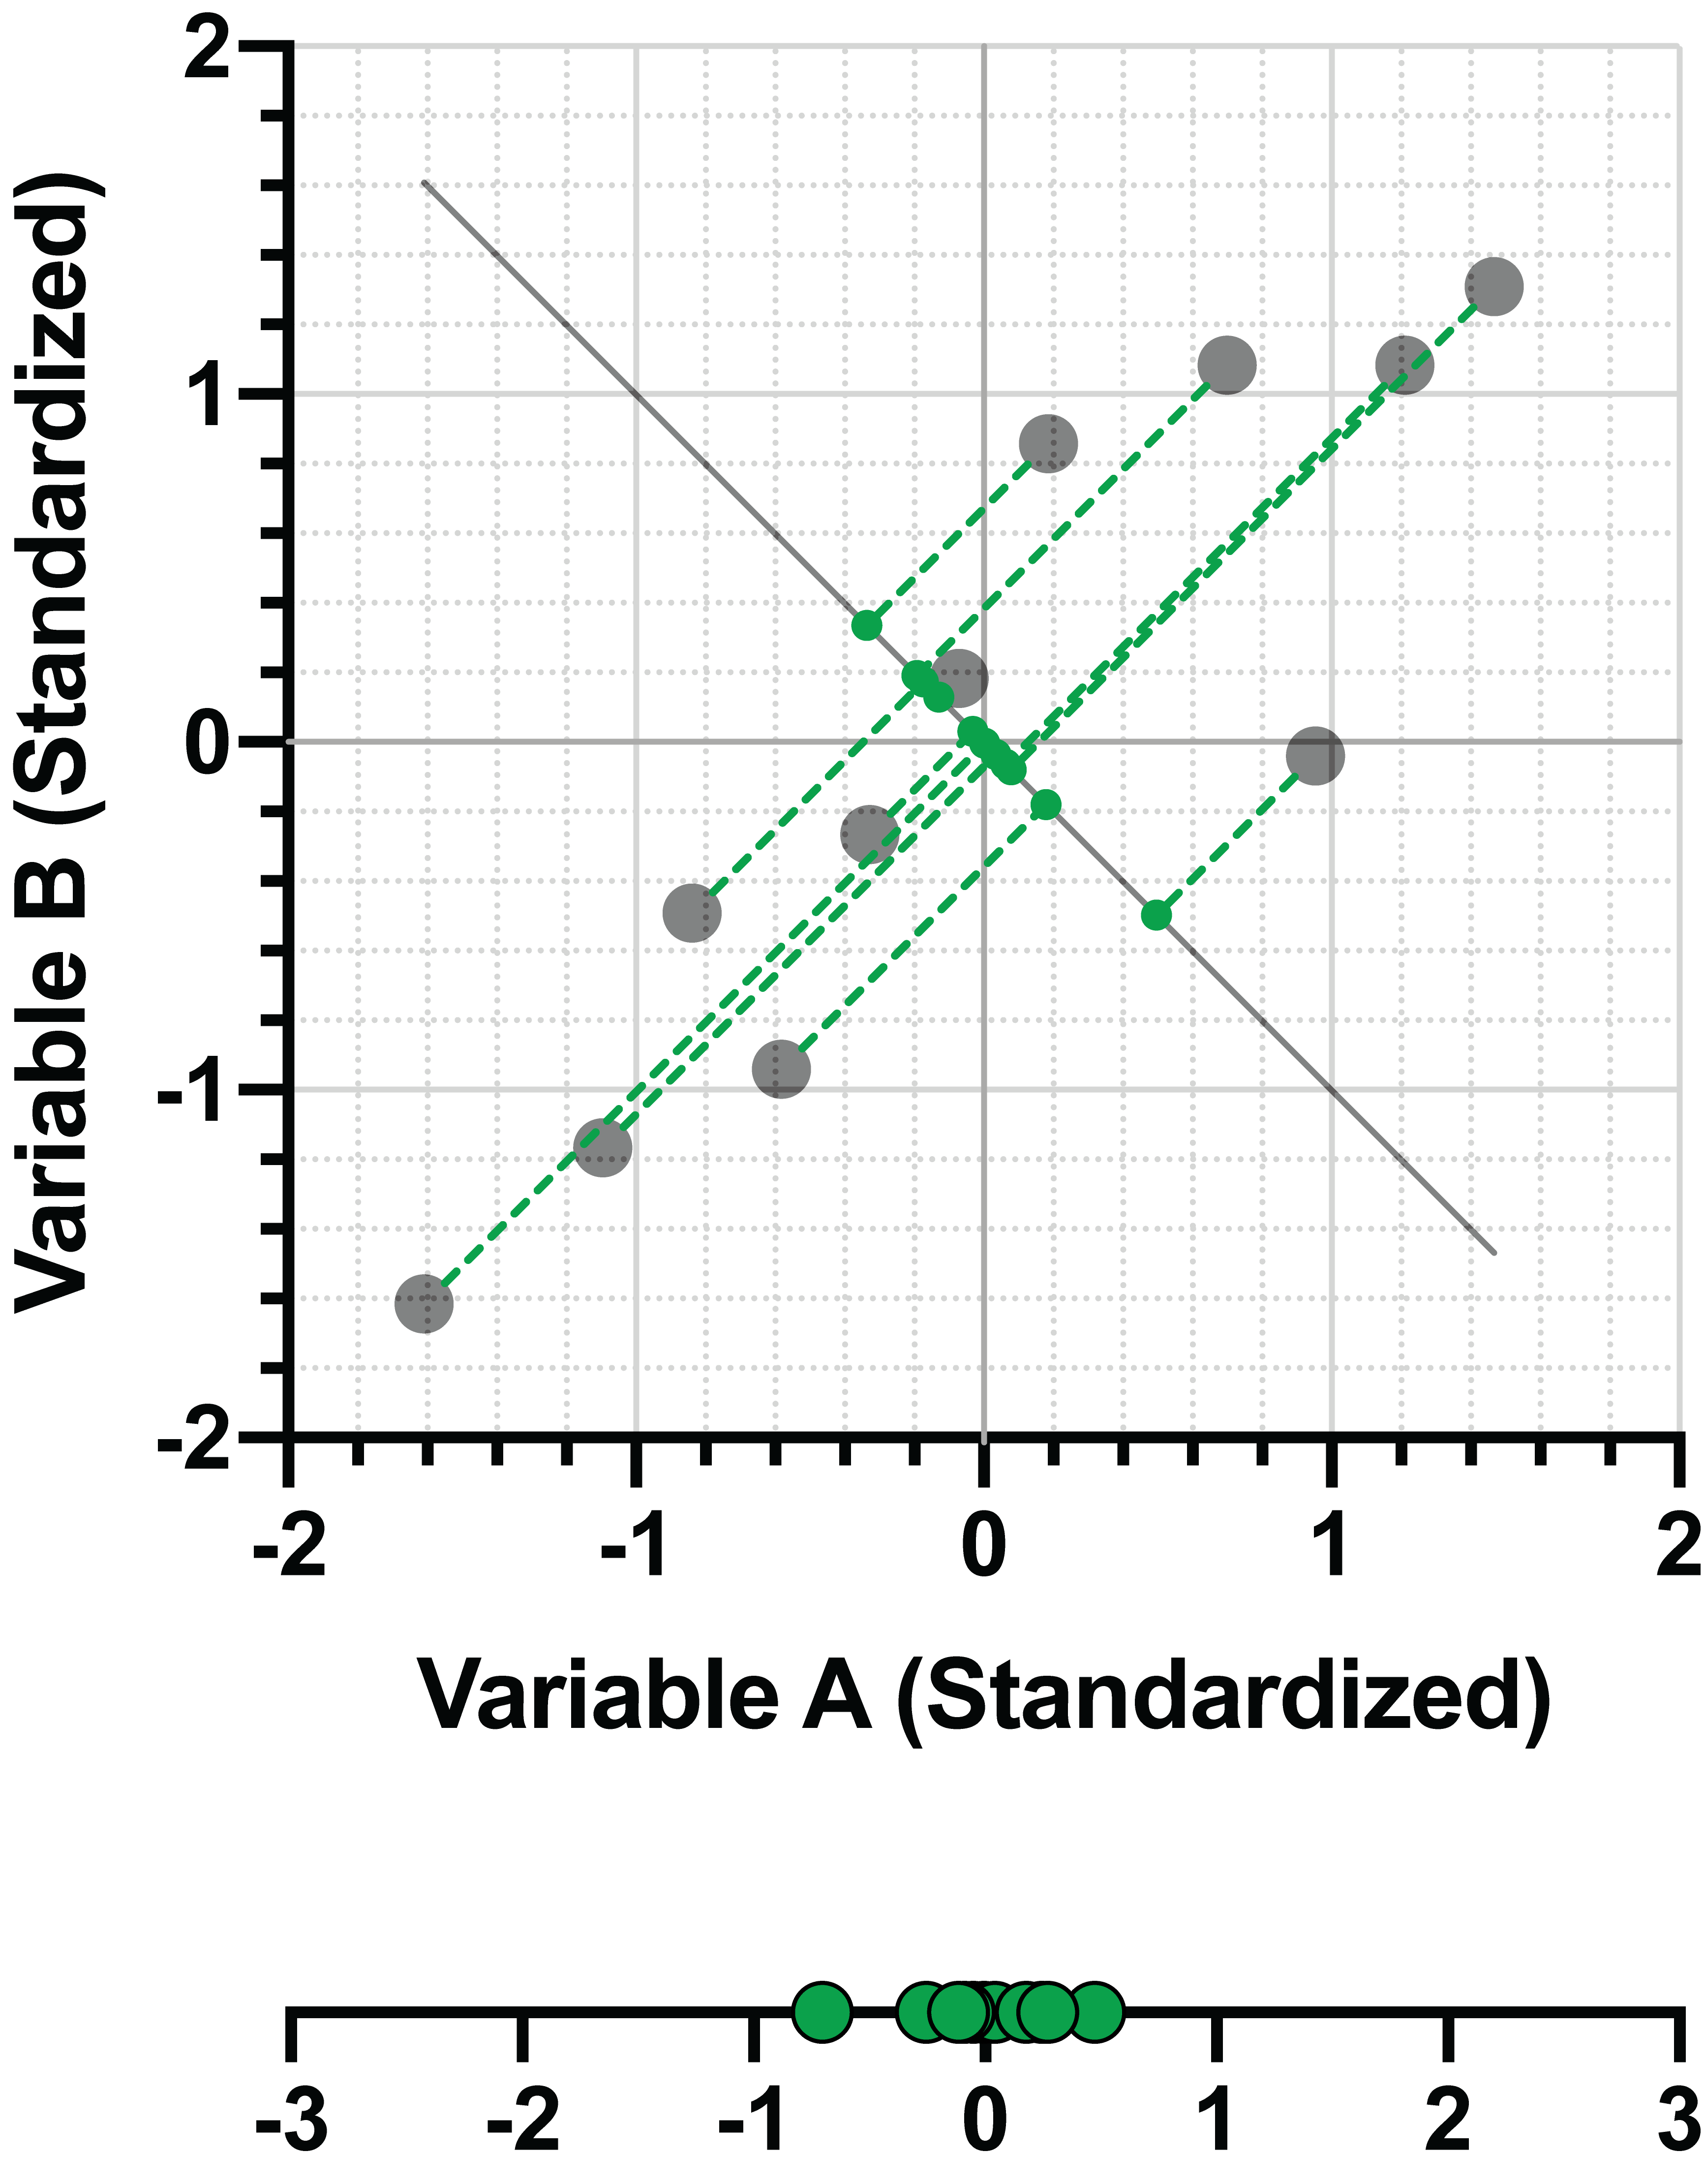
We know the graph of this data looks like the following, and that the first PC can be defined by maximizing the variance of the projected data onto this line (discussed in detail in the previous section):
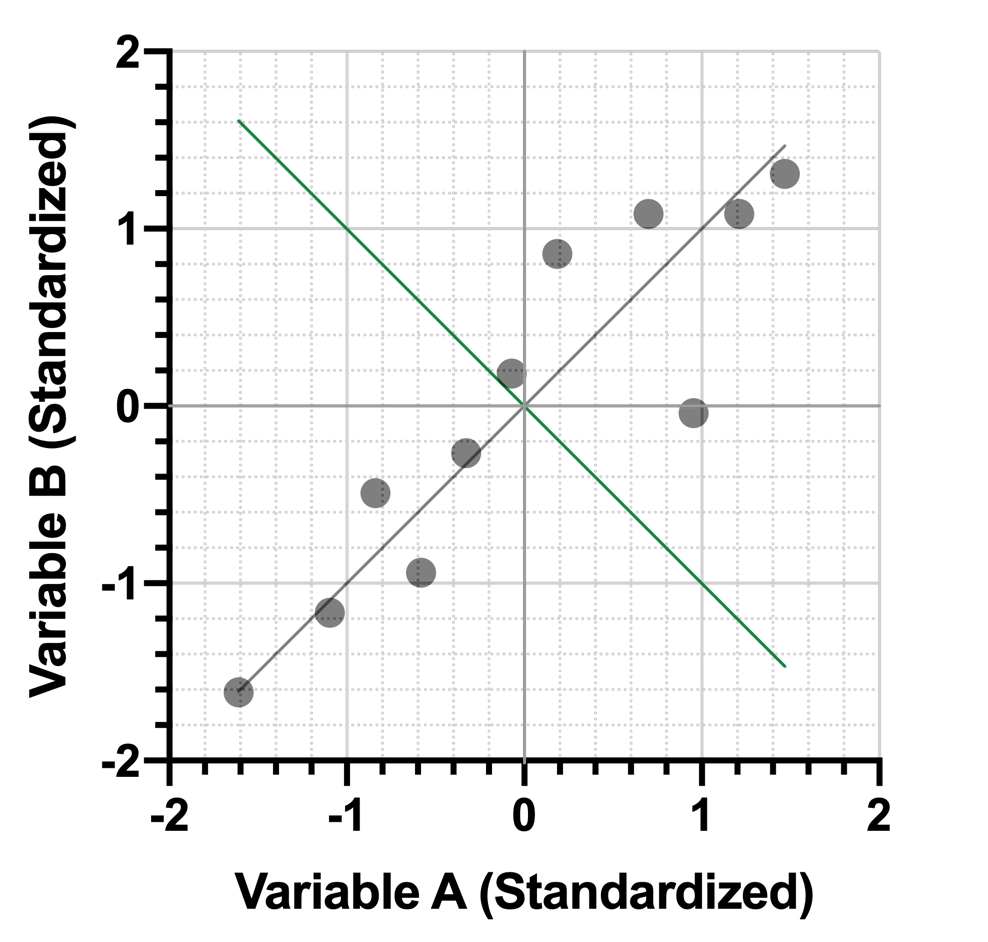
Because we’re restricted to two dimensional space, there’s only one line (green) that can be drawn perpendicular to this first PC:
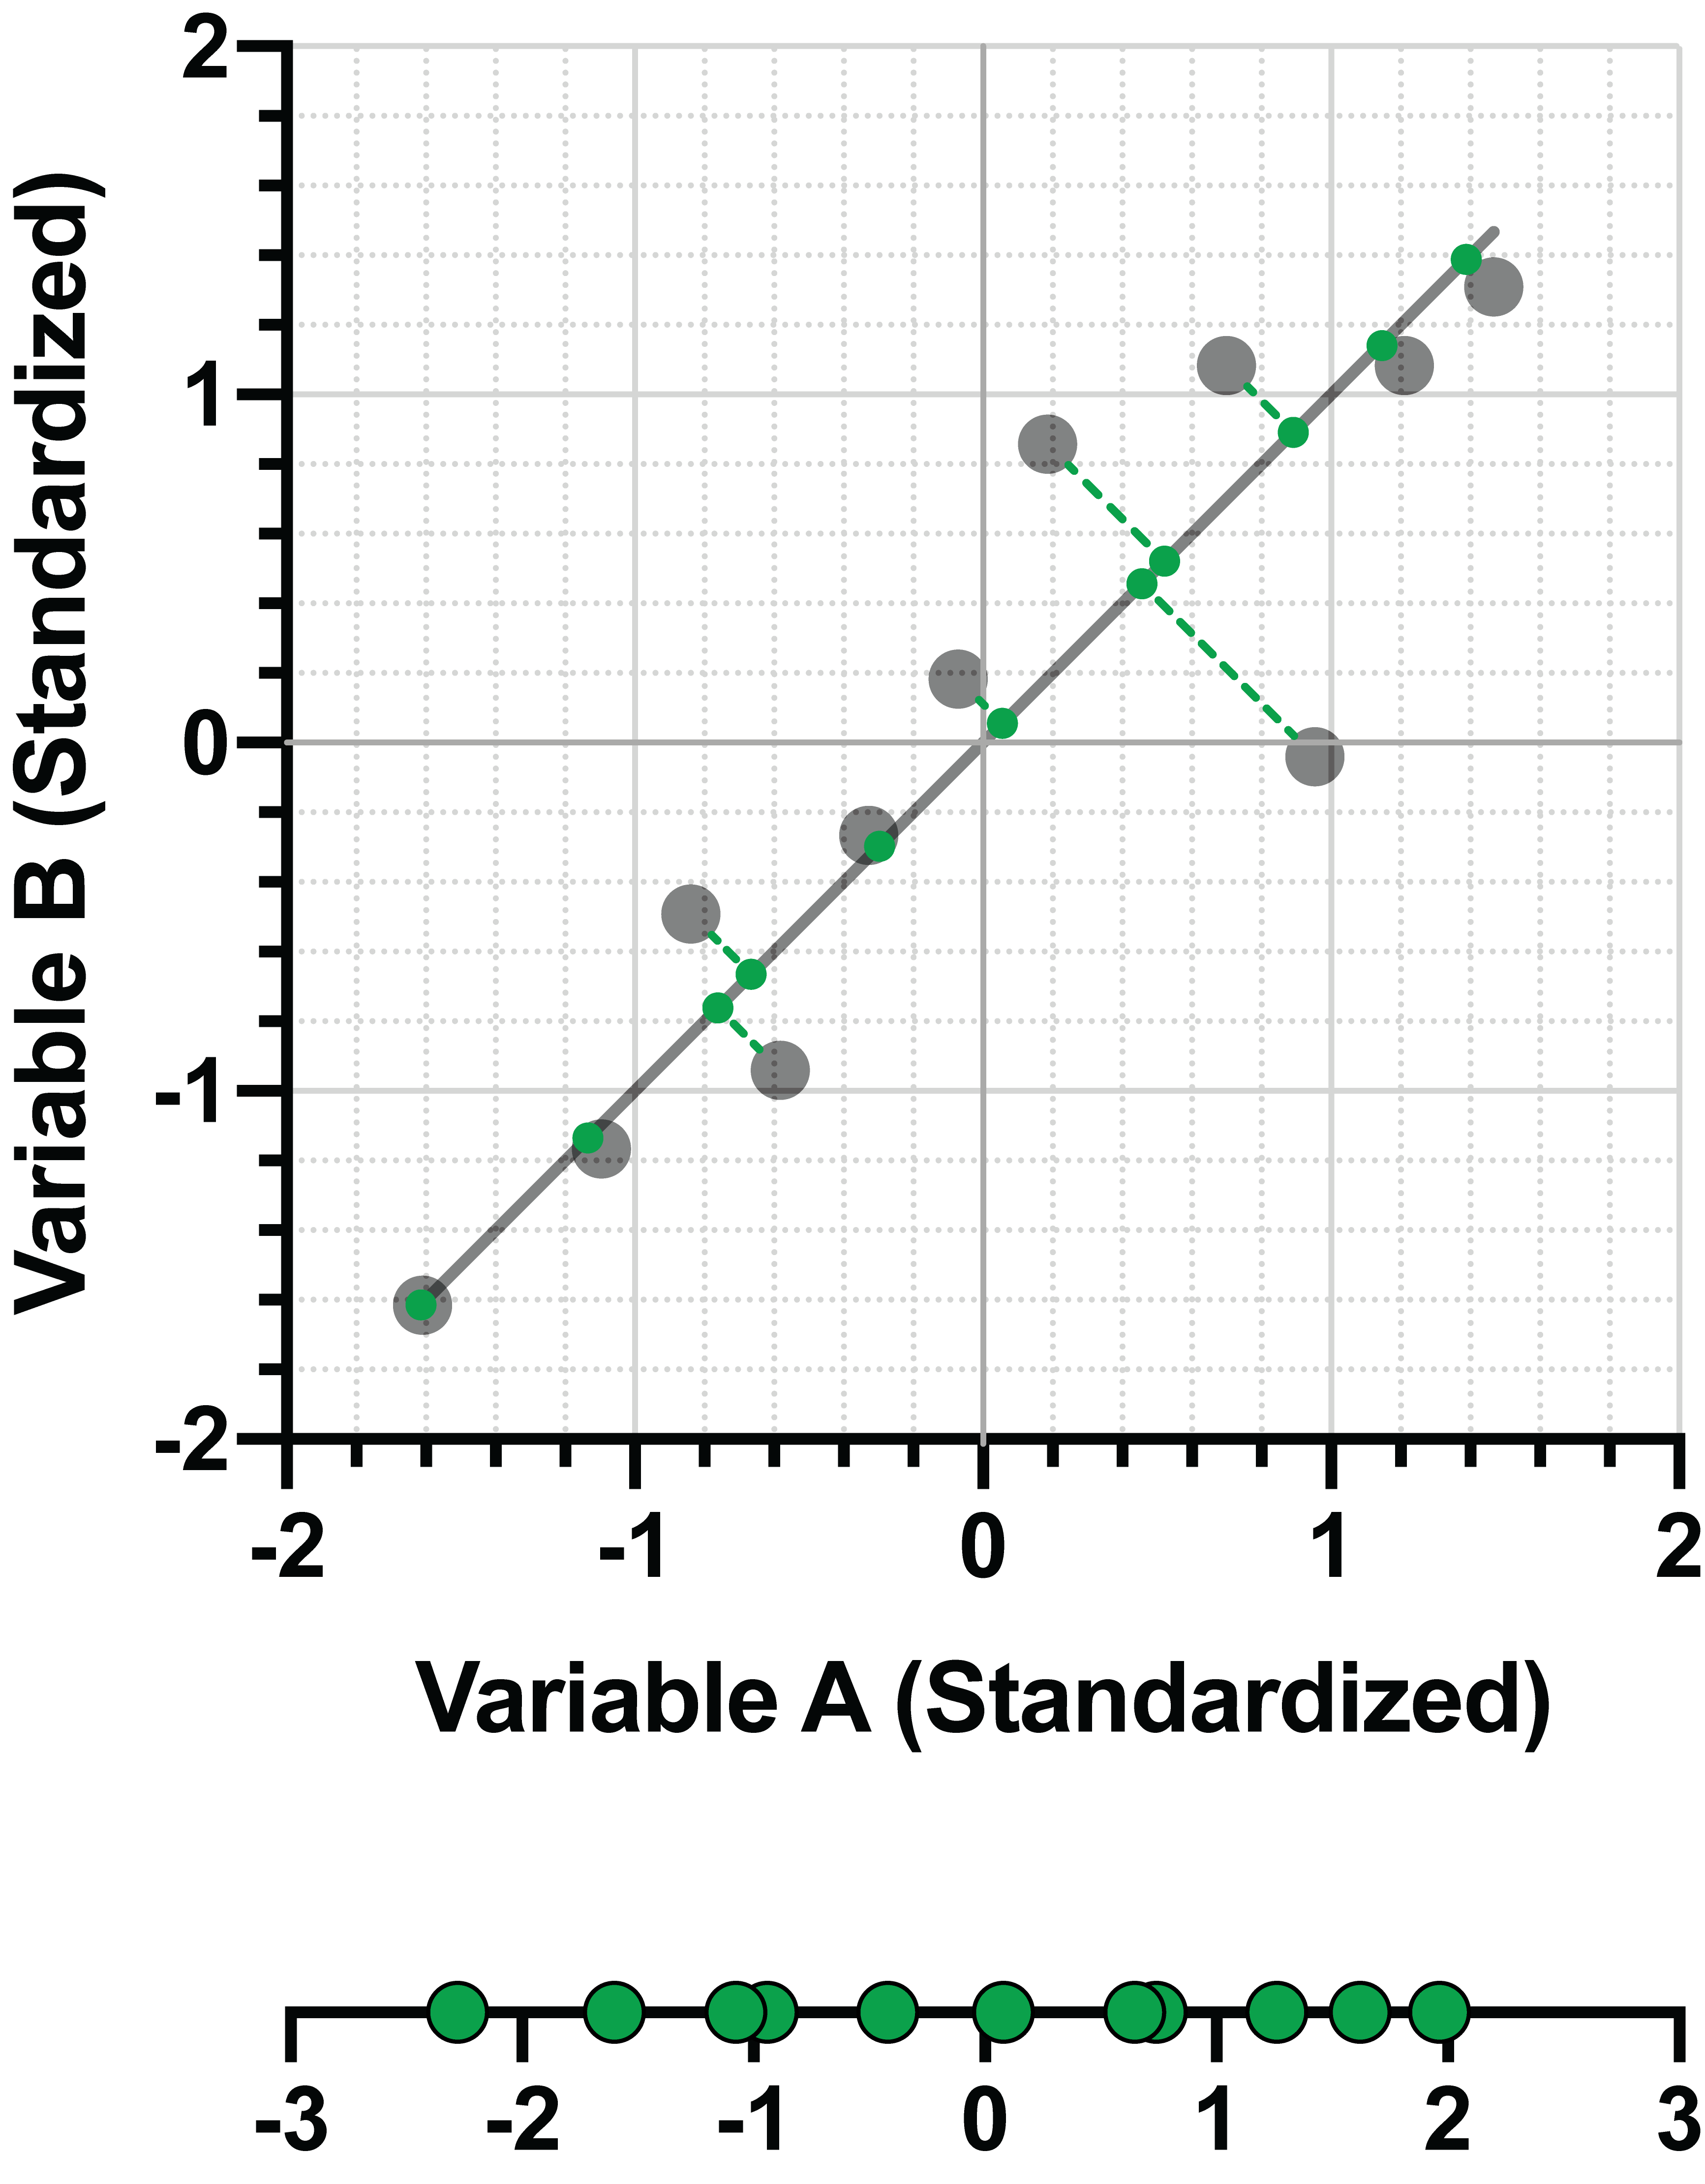
In an earlier section, we already showed how this second PC captured less variance in the projected data than the first PC:
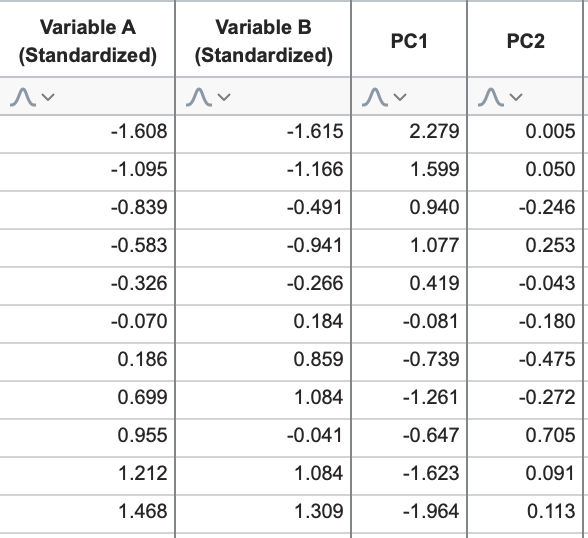
However, this PC maximizes variance of the data with the restriction that it is orthogonal to the first PC. As before, we can represent this PC as a linear combination of the standardized variables. Here are the linear combinations for both PC1 and PC2:
PC1 = 0.707*(Variable A) + 0.707*(Variable B)
PC2 = -0.707*(Variable A) + 0.707*(Variable B)
Advanced note: the coefficients of this linear combination can be presented in a matrix, and are called “Eigenvectors” in this form. This matrix is often presented as part of the results of PCA
Using this linear combination, we can add the “scores” for PC2 to our data table:
If the original data contain more variables, this process can simply be repeated:
•Find a line that maximizes the variance of the projected data on this line. This is the first PC
•Find a line that maximizes the variance of the projected data on the line AND is orthogonal with every previously identified PC. This is the next PC
Visualizing how this process works in two-dimensional space is fairly straightforward. Understanding how three lines in three-dimensional space can all come together at 90° angles is also feasible (consider the X, Y and Z axes of a 3D graph; these axes all intersect each other at right angles). However, as the dimension of the original data increases, the number of possible PCs also increases, and the ability to visualize this process becomes exceedingly complex (try visualizing a line in 6-dimensional space that intersects with 5 other lines, all of which have to meet at 90° angles…).
Fortunately, the process of identifying all subsequent PCs for a dataset is no different than identifying the first two. In the end, you’re left with a ranked order of PCs, with the first PC “explaining” the greatest amount of variance from the data, the second PC “explaining” the next greatest amount, and so on. The next section discusses how this amount of “explained variance” is presented, and what sort of decisions can be made from this information to achieve the goal of PCA: dimensionality reduction.