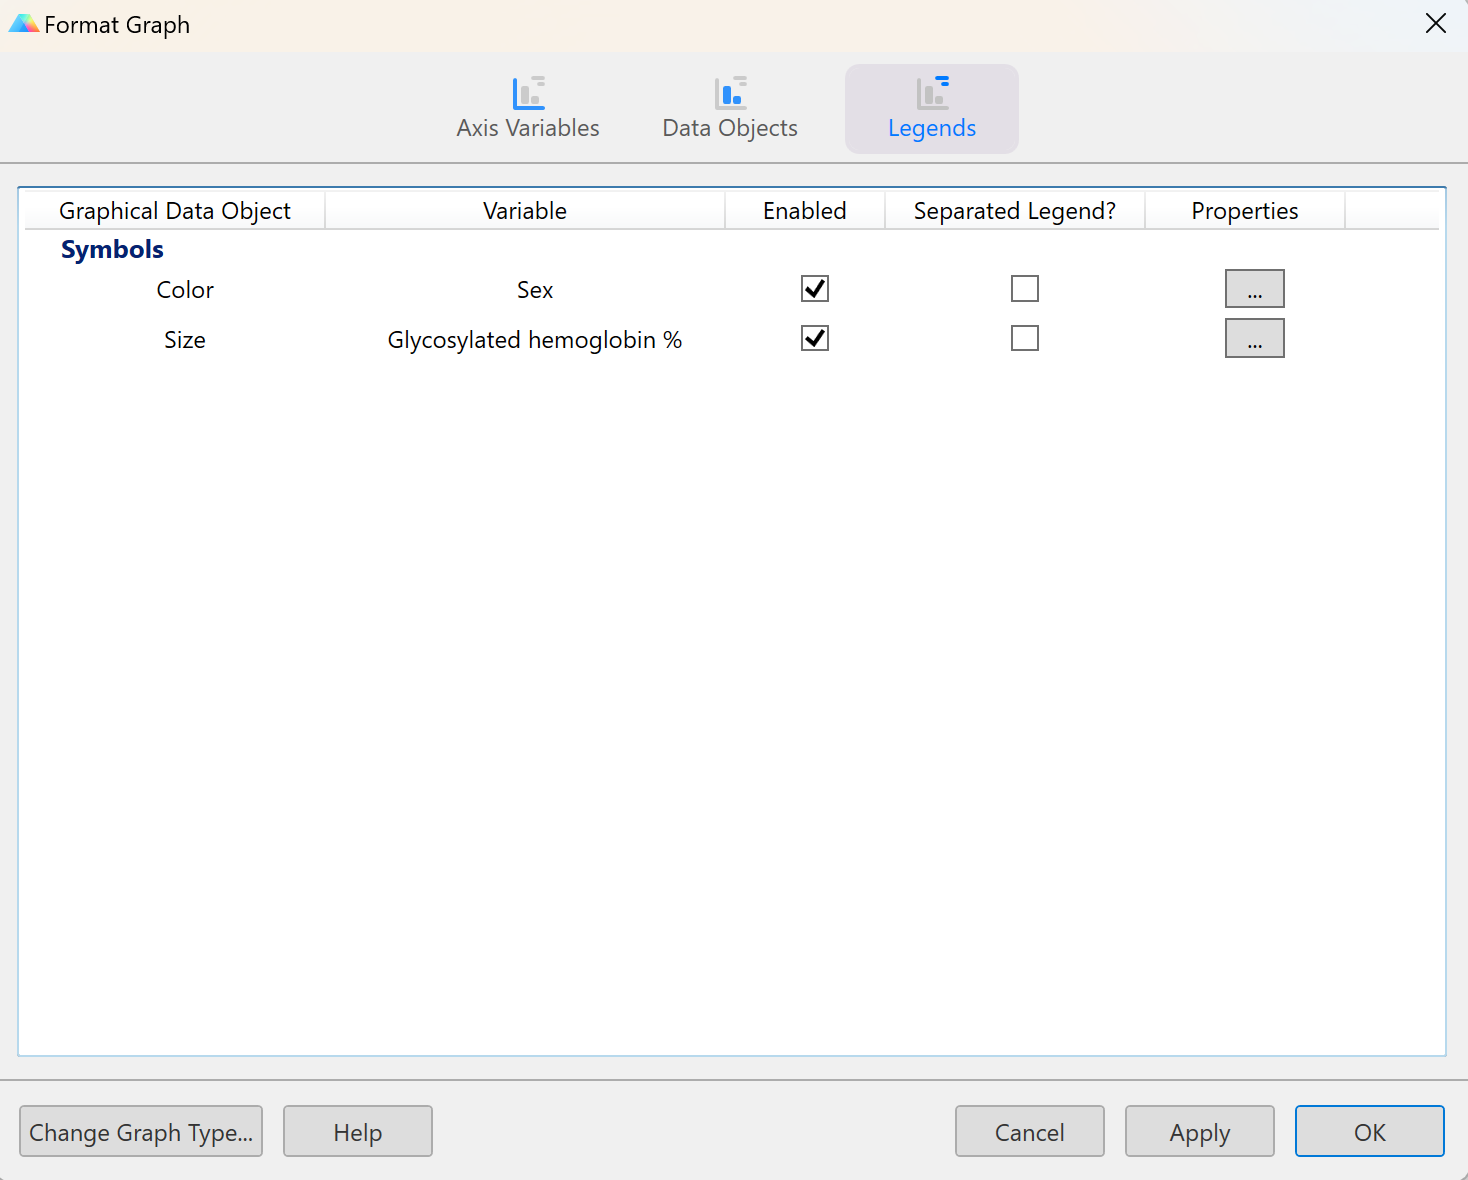
Different kinds of Legends can be displayed for different properties of the Data Objects displayed on a Multiple Variables graph. Each potential legend is listed on its own line in on the Legends section of the Format Graph dialog along with useful information and controls:
•Graphical Data Object: which data object and property is the legend associated with
•Variable: which variable is used to define the data object on the graph
•Enabled: a checkbox which controls whether or not the legend is displayed on the graph
•Separate Legend: a checkbox which instructs Prism whether or not to combine this legend with other legends on the graph (when possible)
•Properties: access to additional controls and format properties for each legend
If you choose to display Individual legends for Fill Color and Size, options to turn on or off these legends separately will be provided via the Fill Color and Size checkboxes. Note that the checkbox control for these two options are shared with checkboxes found on the individual pages for Fill Color and Size options.
Combined Fill Color and Size legend will only be available if combining these two legends makes sense. Unlike other graphs that Prism generates, there are many situations in which multiple legends may need to be displayed to convey the relevant information being displayed on the graph. For example, if the Symbol Fill Color and Symbol Size are defined by different continuous variables, then a legend for Fill Color and a legend for Size will both need to be displayed to fully understand what is being displayed on the graph. On the opposite end of complexity, if both Symbol Fill Color and Symbol Size are set to “One for the entire graph”, then a single Combined (Fill & Size) legend is capable of summarizing all of the information shown on the graph (in fact, by default, a legend wouldn’t even be shown for this graph due to the limited complexity of the data being displayed).The easiest way to figure out if a combined legend makes sense is to consider the following two questions:
•Is Symbol Fill Color defined by a continuous variable?
•Are the variables defining Symbol Fill Color and Symbol Size different?
If the answer to either of those questions is “Yes”, then a Combined Fill Color and Size legend will NOT be possible. If this option is not possible, then the option will be “grayed out” and you will not be able to select it on this page (or in the list of pages on the left side of the dialog).