Overview
Prism 10 includes some major technological advances, including massive changes under the hood as well as some brand new ways to work with your data and graphs. However, nothing fundamental has changed: if you've been using Prism already, you won't need to re-learn how things work. If you're new to Prism, things are as easy as ever. Prism 10 includes many new features to let you perform the analysis you want, access the results you need, and generate the graphs that will help you present your research effectively. This version of Prism also increases the amount of data you can work with, doubling the amount of data that you can enter into any table.
Highlights
•A brand new file format: a new file format that won't lock away any of your data, analysis parameters and results, or graphs
•Graph Inspector: an all-new way to interact with and customize graphs of multiple variables data
•Prism Cloud: the easiest way to share and collaborate on the work you do in Prism
•Access to more results: a re-designed and dramatically expanded analysis constant dialog with links to more results than ever
•Room for more data: double the number of columns in any given data table (now over 2000 columns!)
•A new responsive P value summary style: simplify interpretation of your P values regardless of your statistical threshold
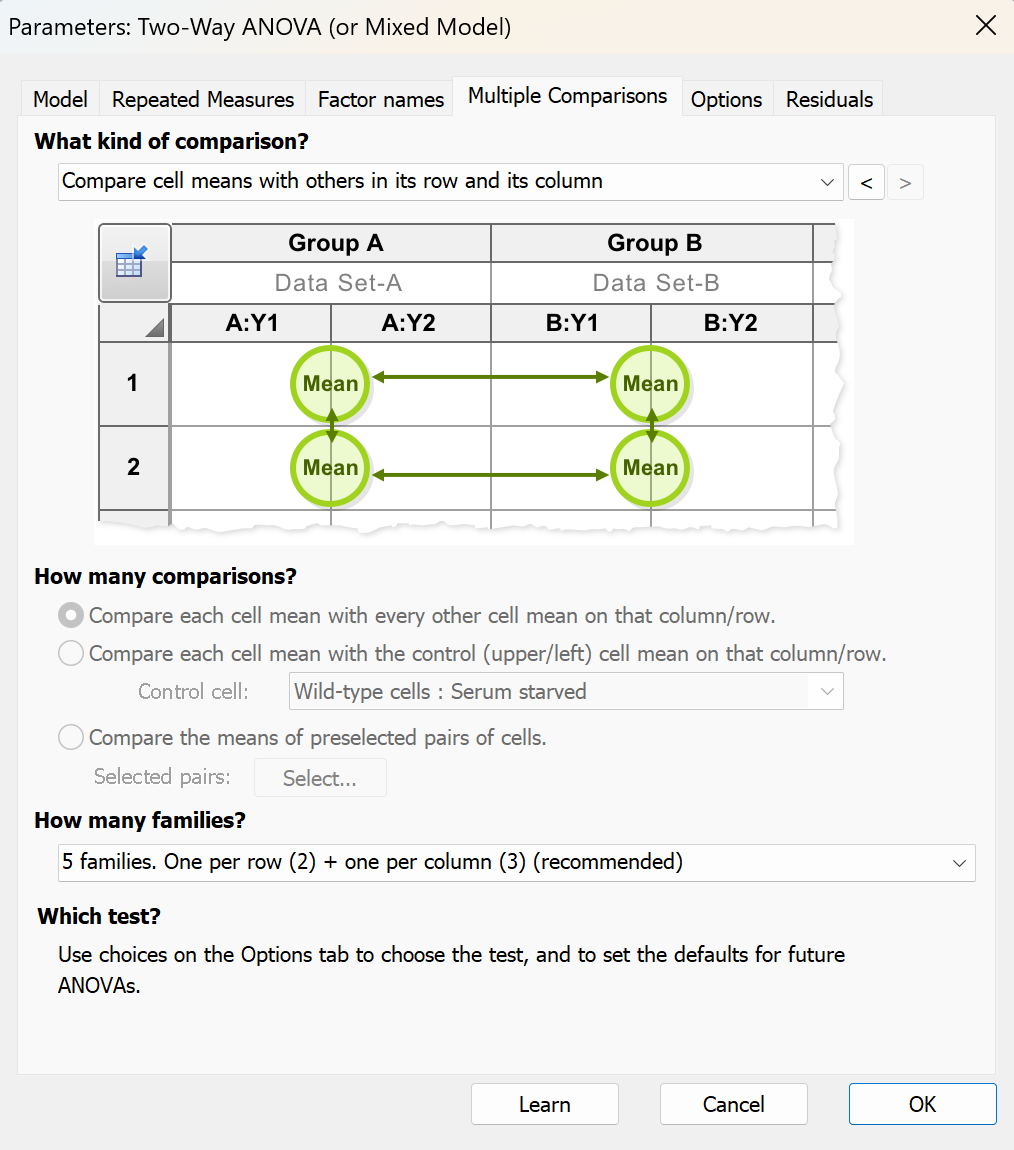
•New options for two-way ANOVA multiple comparisons: comparisons within rows and within columns in a single step
•More data wrangling tools: new transformations available for multiple variables data (IF(), CONCATENATE(), MIN(), MAX(), and more)
Additional Details
•Files created in Prism 10 will have the ".prism" file extension
•Opening and working with existing (.pzfx or .pzf) files will be seamless via Compatibility Mode
•The new file format stores all important content of the file in standard formats within the file itself (CSV for data, JSON for analysis parameters and results, PNG for graphs)
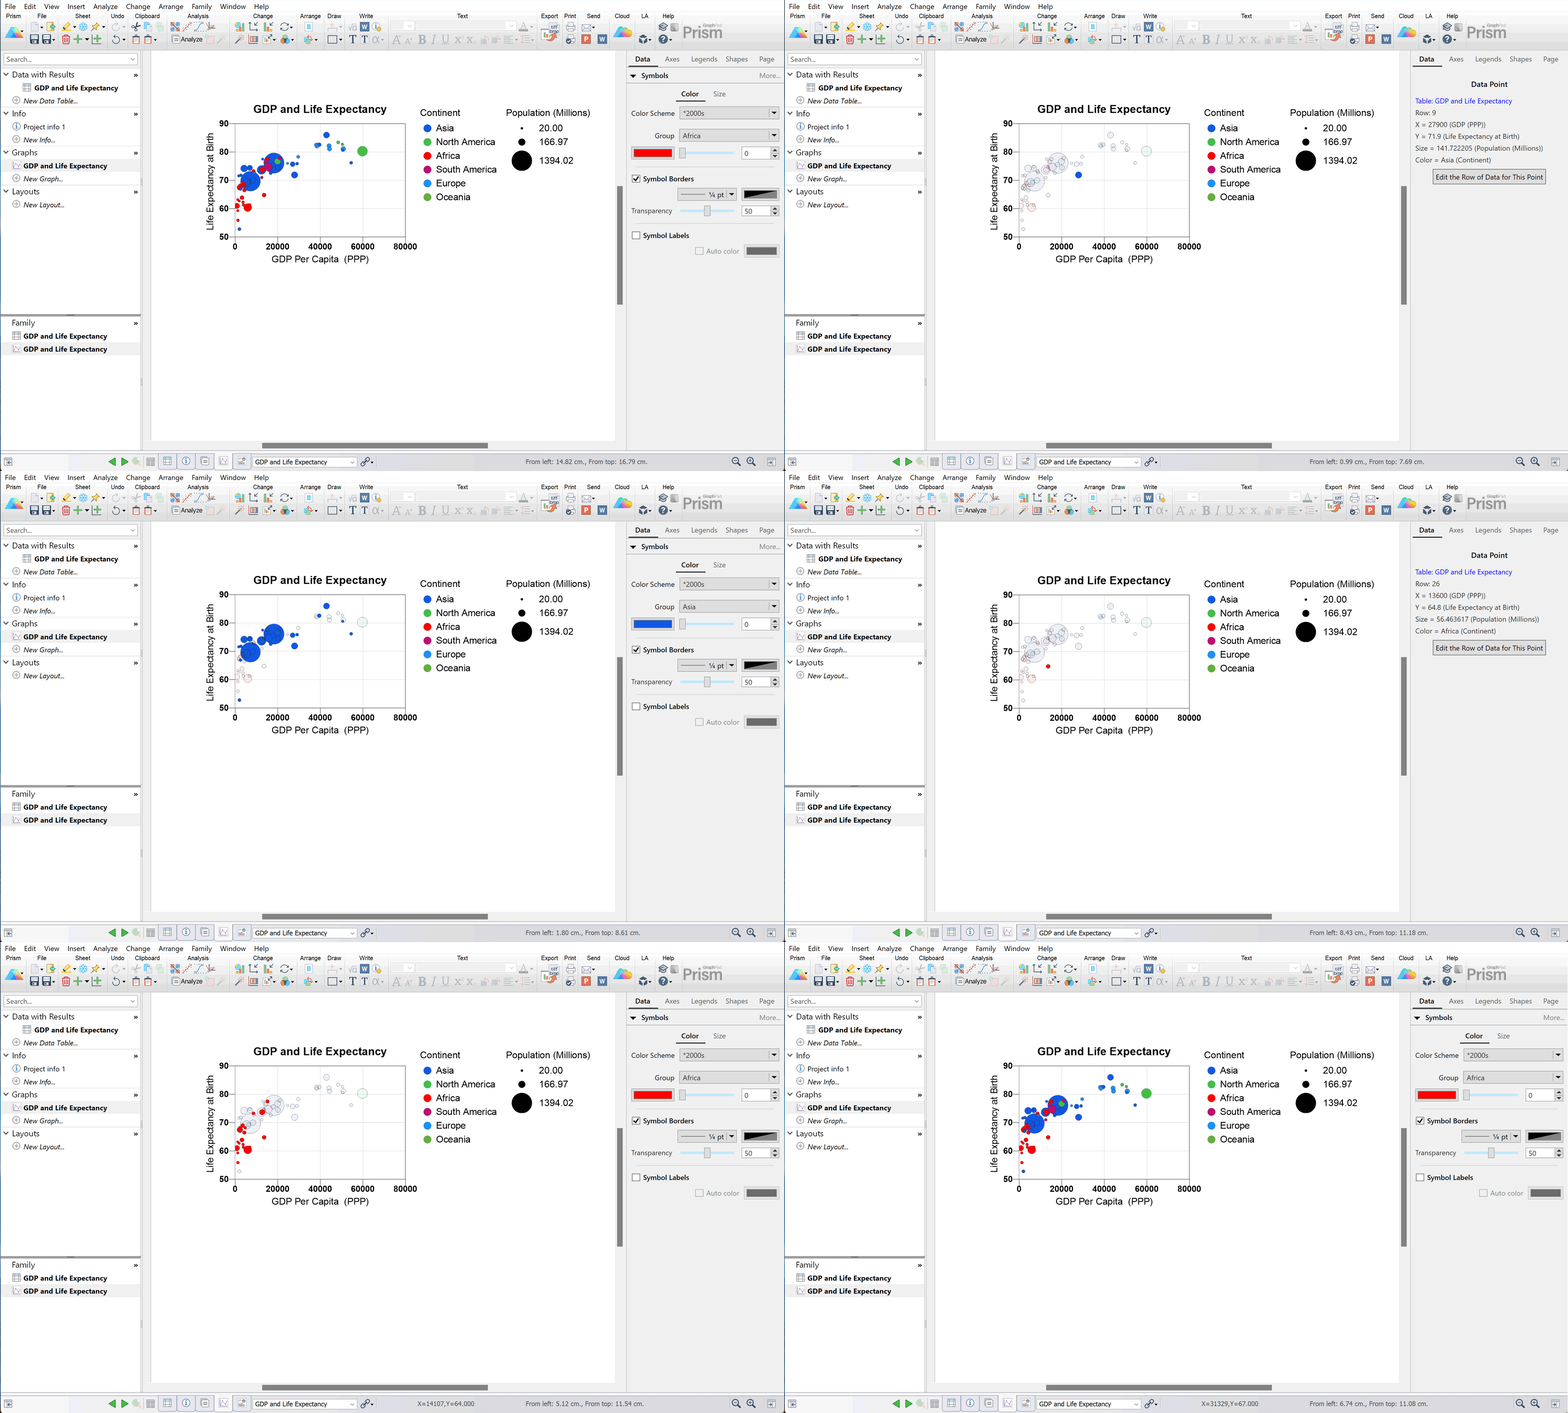
Graph Inspector: a new way to customize multiple variable graphs
•Get hands on with a new way to make visual changes to your graph
•All of the most commonly used tools for graph customization organized into a side panel and broken down into five tabs:
oData
oAxes
oLegends
oShapes
oPage
•The easiest way to collaborate on your work in Prism
•Publish to a Prism Cloud workspace shared with others on your Prism subscription
•Share your published work with others
•Create discussions on published Prism Cloud projects to get immediate feedback (no more sending emails back and forth!)
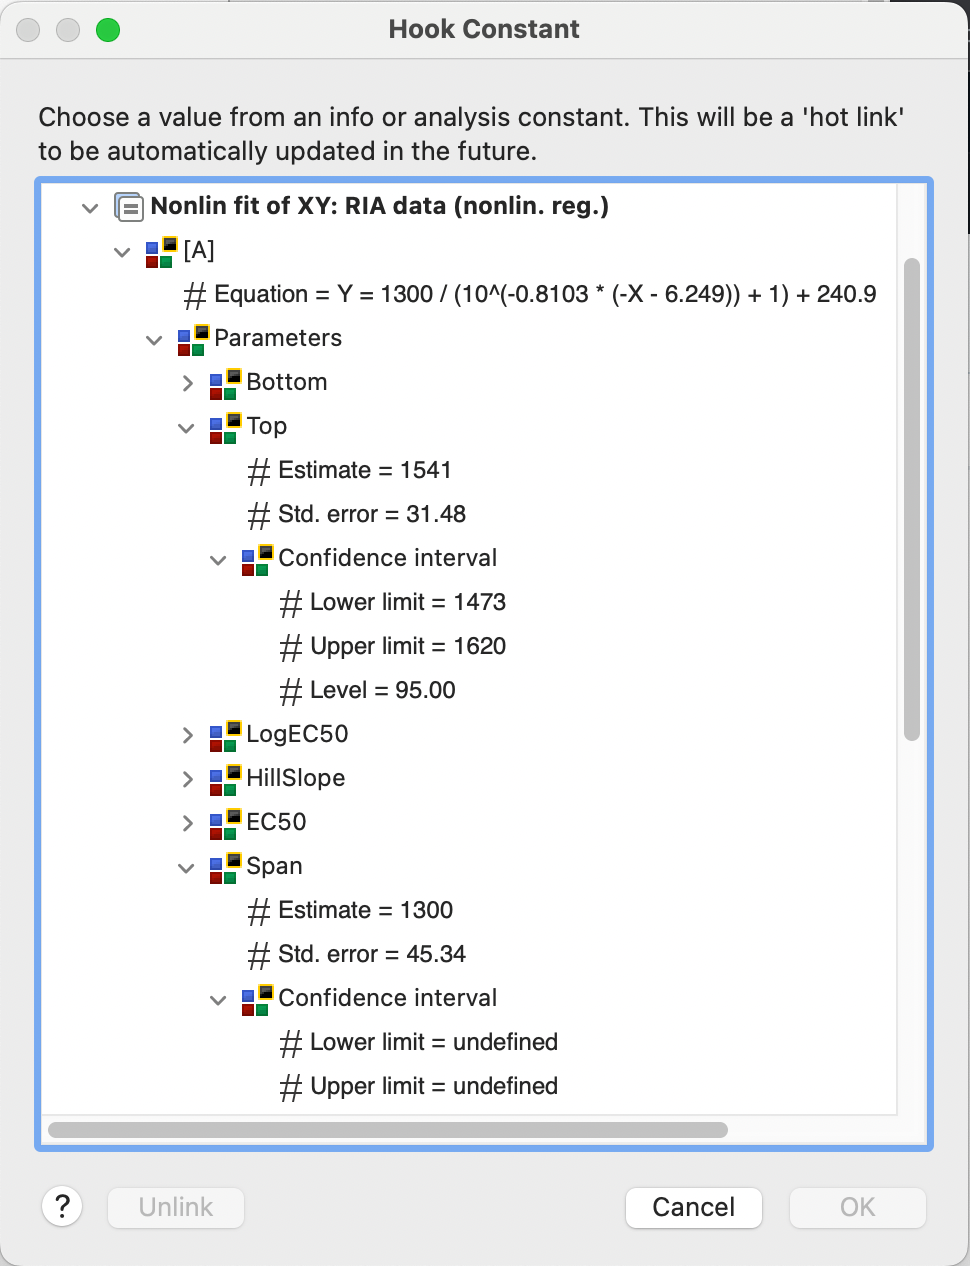
•Redesigned Analysis Constant (Hook Constant) dialog
•Previous versions had limited support for analyses, and had only one level of organization
•New dialog supports nearly all analyses, and organizes complete results for each analysis in easy to navigate hierarchical structures
•Now allows for linking/inserting the model equation with best-fit parameter values from nonlinear regression onto the graph!
•Data tables can now have 2048 columns [letters A...BZT] and 512 sub-columns (that's a possible total of over 1 million values per row).
•Graphs can now plot 2048 data sets.
A new responsive P value summary style
•Making a decision based on a P value requires knowledge of the value of alpha
•Most P value visualizations only consider the P value and not the value of alpha
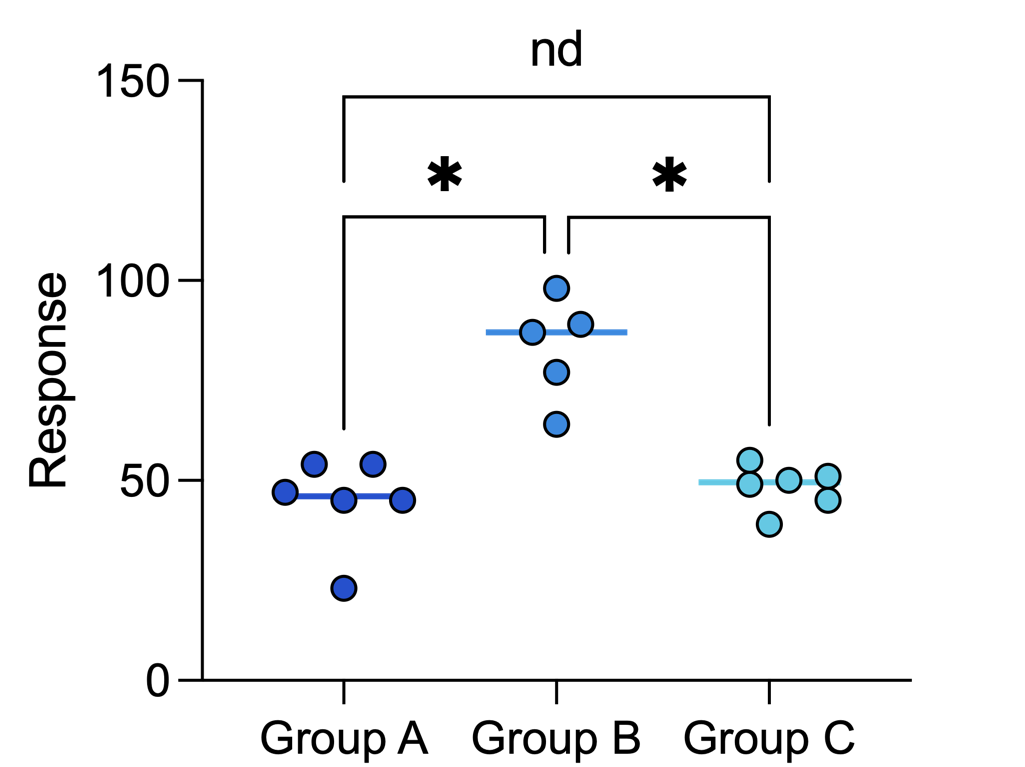
•The new "One or None" P value style takes alpha into consideration for each comparison
o✱ indicates that the P value is smaller than alpha (or that q is smaller than Q for FDR)
ons (or nd) indicates that the P value is larger than alpha (or that q is larger than Q for FDR)
•Reduces the possibility of misinterpreting P value summary results when alpha is a value other than 0.05
•Used automatically for multiple comparisons corrected with the False Discovery Rate (FDR) method
Two way ANOVA multiple comparison options
•New kind of multiple comparison: "Compare cell means with others in its row and its column"
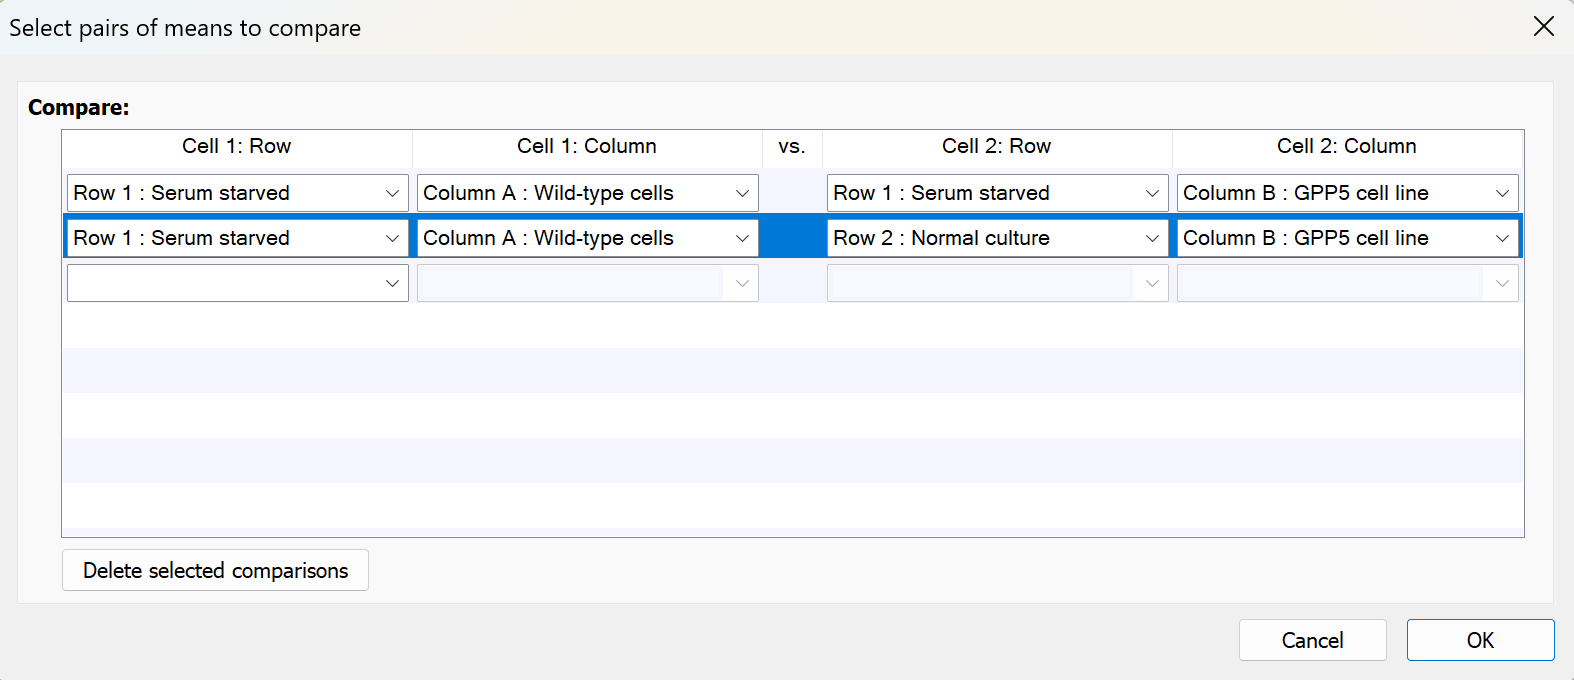
•Choose to compare the means of preselected pairs of cells
•New transformations for the Select and Transform analysis
oSummary transformations: min(Variable), max(Variable), mean(Variable)
oConcatenate transformation: Concatenate("A","+","B") = "A+B"
oIf function: if(pi(1)>3,"A","B") = "A" (note: pi(1) = 3.14159...)
oNew forms of "And" and "Or" functions: and(value1,value2,...) = (value1 AND value2 AND...)
•Row filter controls for Select and Transform to return only rows where values for a given variable are not missing (previously, this analysis could return rows where values ARE missing, but that's often less helpful)
•When using extract and rearrange for XY data, define a subject variable to ensure that values are placed into the appropriate subcolumn and subcolumn titles are automatically assigned
Features added since 9.0 you may have missed
Cox Proportional Hazards Regression
•An advanced statistical method of survival analysis that allows for the incorporation of any number of predictor variables (both categorical and continuous) into the model
•Performed from the multiple variables data table
•Semi-parametric analysis capable of generating survival estimates for any individual or group with any combination of predictor variable values
Prism Academy
•Graphpad's online statistics and data visualization learning center!
•Over 125 videos with hours of learning material taught by highly-technical experts
•Included with Prism subscription
An all-new searchable Analyze menu
•All of Prism's analyses added to the "Analyze" menu for easy access
•Analyze menu organized into six primary categories: Data Processing, Data Exploration and Summary, Regression and Curves, Group Comparison, Survival Analysis, Simulation
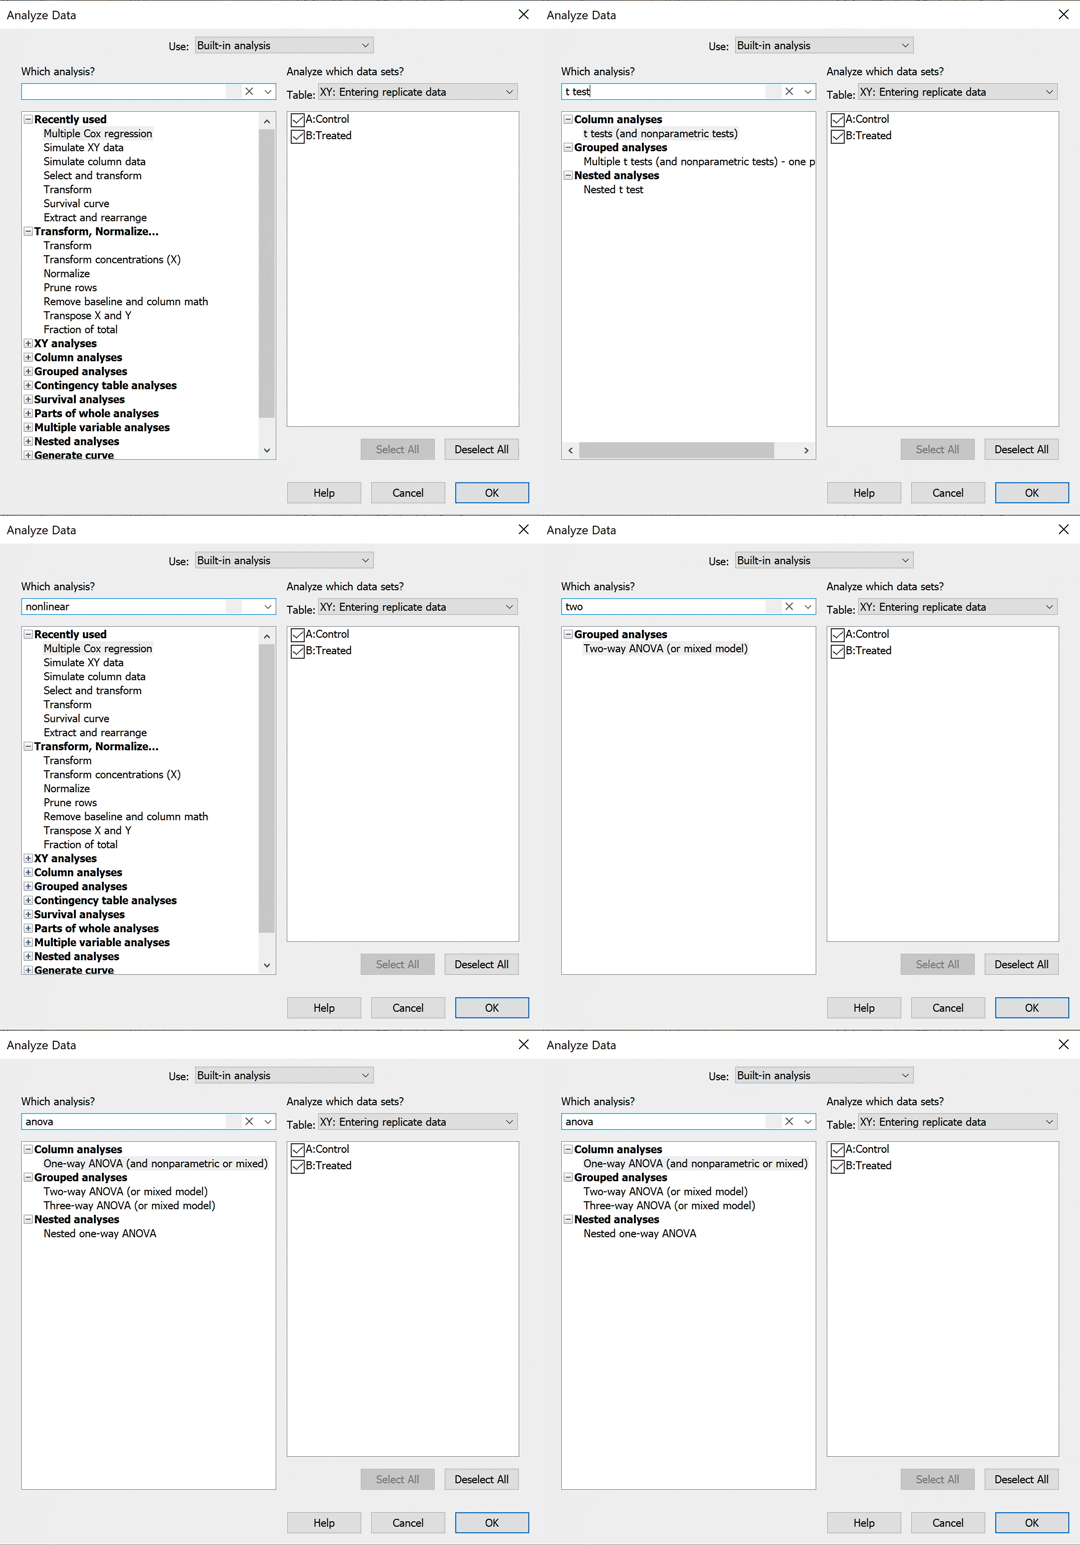
•Search bar added to Analyze data dialog allowing for quick filtering of analyses of interest
