ROUT coefficient
If you ask Prism to automatically exclude outliers (a choice on the Fit tab) or to count (but not remove from the analysis) outliers (a choice on the Diagnostics tab), set the ROUT coefficient to determine how aggressively Prism defines outliers.
We recommend using a value of 1%. Our simulations have shown that if all the scatter is Gaussian, Prism will falsely find one or more outliers in about 2-3% of experiments. If there really are outliers present in the data, Prism will detect them with a False Discovery Rate less than 1%. See reference 1.
If you set Q to a higher value, the threshold for defining outliers is less strict. This means that Prism will have more power to detect outliers, but also will falsely detect 'outliers' more often. If you set Q to a lower value, the threshold for defining outliers is stricter. This means that Prism will have a less power to detect real outliers, but also have a smaller chance of falsely defining a point to be an outlier.
If you set Q to 0, Prism will fit the data using ordinary nonlinear regression without outlier identification.
Unequal weighting
It is often useful to differentially weight the data points. Learn why.
Prism offers seven choices on the Weight tab of nonlinear regression:
No weighting. Regression is most often done by minimizing the sum-of-squares of the vertical distances of the data from the line or curve. Points further from the curve contribute more to the sum-of-squares. Points close to the curve contribute little. This makes sense, when you expect experimental scatter to be the same, on average, in all parts of the curve.
Weight by 1/Y^2. In many experimental situations, you expect the average distance (or rather the average absolute value of the distance) of the points from the curve to be higher when Y is higher. The points with the larger scatter will have much larger sum-of-squares and thus dominate the calculations. If you expect the relative distance (residual divided by the height of the curve) to be consistent, then you should weight by 1/Y2.
Weight by 1/Y. This choice is useful when the scatter follows a Poisson distribution -- when Y represents the number of objects in a defined space or the number of events in a defined interval.
Weight by 1/YK. Also called "General weighting". Read more.
Weight by 1/X or 1/X2 .These choices are used rarely. Only choose these weighting schemes when it is the standard in your field, such as a linear fit of a bioassay.
Weight by 1/SD2. If you enter replicate Y values at each X (say triplicates), it is tempting to weight points by the scatter of the replicates, giving a point less weight when the triplicates are far apart so the standard deviation (SD) is high. But unless you have lots of replicates, this doesn't help much. The triplicates constituting one mean could be far apart by chance, yet that mean may be as accurate as the others. Weighting needs to be based on systematic changes in scatter. The choice to weight by 1/SD2 is most useful when you want to use a weighting scheme not available in Prism. In this case, enter data as mean and SD, but enter as "SD" weighting values that you computed elsewhere for that point. In other words, the values you enter in the SD subcolumn are not actually standard deviations, but are weighting factors computed elsewhere.
Notes on weighting
•If you have normalized your data, weighting rarely makes sense.
•Simulations can show you how much difference it makes if you choose the wrong weighting scheme.
•If you choose unequal weighting, Prism takes this into account when plotting residuals.
•Prism accounts for weighting when it computes R2.
•Learn about the math of weighting and how Prism does the weighting.
•If you choose robust regression (on the first, Fit, tab) then choices you make on the weighting tab will not influence the fitting, so will no influence the best-fit parameter values or the curve. However your choice of weighting will have an impact on the residuals Prism computes and graphs and on how it identifies outliers. Both these choices (residuals, and outlier counting) are on the Diagnostics tab of nonlinear regression.
Replicates
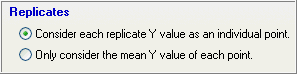
In most experiments, it is fair to consider each replicate to be an independent data point, and you should choose that first choice unless you have a strong reason not to.
If you entered the data as mean, n, and SD or SEM the wording is a bit different. You can account for sd and n and get exactly the same results you would have gotten had you entered raw data (except for robust regression, and outlier determination which require raw data). Or you can fit the means only, and ignore n and the entered SD or SEM.
Here is an example where you would want to fit only the means: You performed a dose-response experiment, using a different animal at each dose with triplicate measurements. The three measurements are not independent. If one animal happens to respond more than the others, that will affect all the replicates. Since the replicates are not independent, you should fit the means.
Reference
1.Motulsky HM and Brown RE, Detecting outliers when fitting data with nonlinear regression – a new method based on robust nonlinear regression and the false discovery rate, BMC Bioinformatics 2006, 7:123..