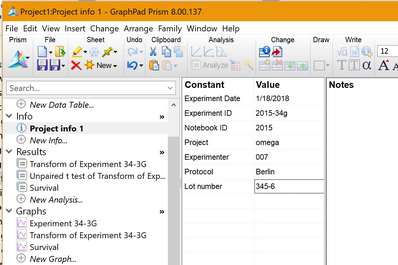
Key concepts: Info sheets
•Use Info sheets to record experimental details and constants you want to use in analyses.
•The left side of an info sheet is a table of structured information. The right side is for unstructured notes
•Each project can have up to 500 info sheets. Each Info sheet can be linked to a particular data table, but doesn't have to be.
•The info constants can be used (hooked) in analyses.
Create and edit an Info sheet
To create an info sheet, click the New button on the toolbar, or drop the Insert menu. Choose New Info. Select whether the new sheet should be linked to a particular data table, or a global Info sheet for the project.
How to use Info Sheets
To embed all or part of an Info table onto a graph or layout:
Select all or part of the Info table, and copy to the clipboard. Then go to a graph or layout and paste. This will be a live link, updated if you edit the info table. Double-click on the embedded table to adjust its properties.
To insert an Info constant into a graph title, legend, or text object:
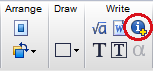
While entering text, use the right-click menu or click on the Inset Info Constant button in the Write section of the Prism toolbar. Prism will maintain a link to the constant, updating the text when you edit the info table.
To change the order of the rows on an Info sheet, or to delete a row:
Click on a row, then click the right mouse button. From the shortcut menu, choose to move the selected row up or down, or choose to delete that row. Or use the buttons on the Change toolbar.
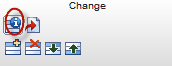
To link a global Info sheet to a specific data table:
Click this button in the Change toolbar to bring up a dialog to select which data table the Info Sheet is linked to.
To change which info constants appear by default on new Info sheets:
Use the Info Sheet tab of the Preferences dialog. You can also choose whether or not Prism will automatically create a linked Info sheet to accompany every new data table you create
To import info constants into an Info sheet at the same time you import data:
To hook info constants into an analysis or graphing dialog.
You can "hook" Info sheet constants as constraints in nonlinear regression or as constants when transforming.
You can also Hook to Info sheet constants to create custom ticks, set axis limits, etc.
You'll know when it’s possible to insert ("hook") an info constant, because you'll see the fishhook icon next to the number entry field.

When you see this button in a dialog, click on it to bring up a list of all Info and Analysis constants that can be hooked.
To insert a text file into the notes portion of an Info sheet:
Drop the File menu and choose Import.