What is hooking?
Prism lets you 'hook' the results of some analyses into the parameters dialog of other analyses, and graphing dialogs. The value you hooked is then used in that analysis, or graphing choice. The link is live, so will be updated if the data are edited or (in some cases) if the analysis parameters changed.
You can also hook constants entered on an Info sheet.
Which analysis results can be hooked?
Here is the list of all analysis results that can be hooked.
Analysis |
Values that can be hooked |
||||||||||||||||||||||
Nonlinear regression |
|
||||||||||||||||||||||
Survival analysis |
|
||||||||||||||||||||||
Bland-Altman |
|
||||||||||||||||||||||
Descrptive statistics |
|
You cannot add to this list (but we can, so send us suggestions).
How to hook?
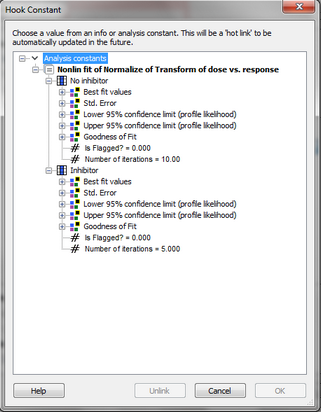
You'll see hook icons  on many dialogs next to fields requiring you to enter a value. Click, and then choose an analysis constant (or info constant) on the Hook dialog.

Example 1. QC plot
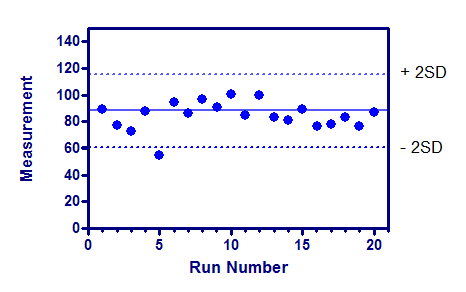
The graph shows repeated quality control measurements. The descriptive statistics analysis was run to compute the mean and SD (and more) of the values. The lines at the mean and plus or minus two standard deviations were drawn by hooking these values. This means that the grid lines will move as more data are entered into the data table.
First double click on the Y axis to bring up the Format Axes dialog on the Y axis tab. The bottom of the dialog lets you add additional ticks and grid lines. To hook the grid line to an analysis constant requires drilling down to the details dialog, so click the '...' button.
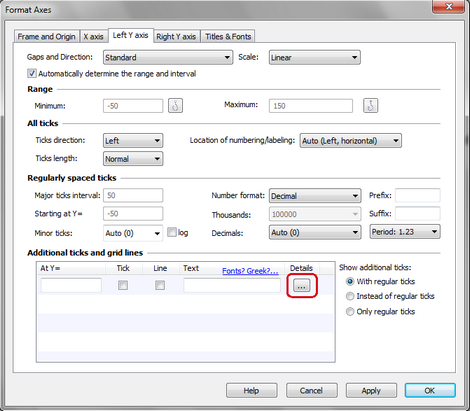
You don't want to enter a Y coordinate on the Format Additional Ticks and Grids dialog. Instead you want to hook an analysis constant. Click on the hook button, and then choose the value you want to hook (first the mean, later the two QC control lines). Back on the Format Additional Ticks and Grids dialog, choose the kind of line (solid or dotted) and its color. You can also choose to fill between the two QC lines

![analyze7]](./images/analyze7]_zoom70.png)
Example 2. Confidence interval of EC50
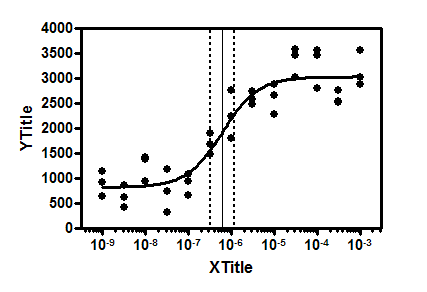
This example shows grid lines at the EC50 along with its 95% confidence interval. All three values were 'hooked' from the nonlinear regression using Additional ticks and grid lines, so will move if data are edited or replaced.