Reality check
It is very common to publish data with error bars, and Prism does this well. But first think if this is really the best way to display your data. Consider plotting each replicate or plotting a violin plot instead. These kind of graphs show much more detail.
What Prism can do
When you entered replicate data, Prism can plot on XY and Grouped graphs:
•Mean only
•Mean with error bars computed as SD, SEM, 95% CI, or range.
•Geometric mean only
•Geometric mean with error bars computed as 95% CI, or geometric SD factor
•Median only
•Median with error bars computed as 95% CI, interquartile range, or range
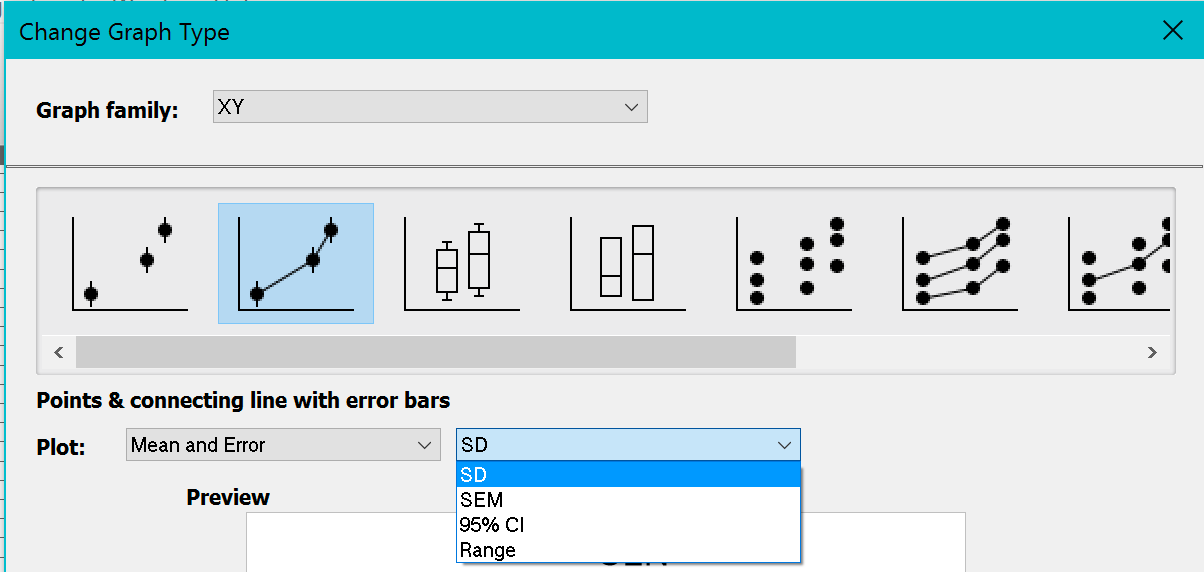
Choose on the New Graph (or Change Graph Type) dialog:
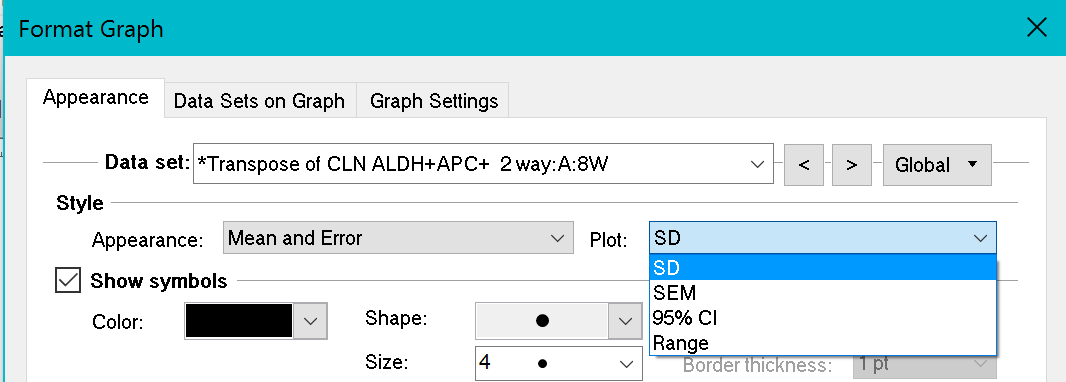
You can also change on the Format Graph dialog. This will change one data set at a time, unless you choose to make Global changes using the control in the upper right of the dialog.