The term repeated-measures refers to an experiment that collects multiple measurements of the dependent variable from each participant. The repeat can be across time (eg. pre/post), across different conditions (eg. high and low temperature), or across space (eg. left knee and right knee). The key issue is that the same participant has multiple responses.
The analysis of repeated measures data is identical to the analysis of randomized block experiments that use paired or matched subjects. In this case, think of the pair or match itself as the “participant.” Prism can calculate repeated-measures two-way ANOVA when either one of the factors are repeated or matched (mixed effects) or when both factors are. In other words, Prism can handle these three situations with its two-way ANOVA analysis:
•Two between-subject variables (neither factor is repeated measures)
•One between-subject variable and one within subject variable
•Two within-subject variables (both factors are repeated measures)
One data table can correspond to four experimental designs
Prism uses a unique way to enter data. You use rows and columns to designate the different groups (levels) of each factor. Each data set (column) represents a different level of one factor, and each row represents a different level of the other factor. You need to decide which factor is defined by rows, and which by columns. Your choice will not affect the ANOVA results, but the choice is important as it affects the appearance of graphs.
The table above shows example data testing the effects of three doses of drugs in control and treated animals.
These data could have come from four distinct experimental designs.
Not repeated measures
Perhaps one of the simplest explanations for the table above is that this experiment was performed using twelve animals, with one measurement per animal. In this case, each cell would represent a different animal. Of course, this would not be a repeated measures experiment.
Another situation could be that the experiment that generated the data above was performed using six animals. Let's say each treatment combination has only one animal and measurements were made in duplicate (two measurements per animal). In this situation, the value in row 1, column A:Y1 (23) came from the same animal as the value in row 1, column A:Y2 (24). These duplicate values for each animal are known as pseudo-replicates. You must be careful when analyzing data from this type of experiment with Prism due to the problem of pseudo-replication. Performing a standard two-way ANOVA in this scenario (with no data treatment) would provide misleading results. Prism would think that there were twelve total animals (as described above) - not six. Because of this, Prism would assume that the variation between pseudo-replicates represented variation between animals. However, in this experimental design, variation between pseudo-replicates actually represents variation within animals. This is an important problem, and there are a number of ways to deal with it (such as averaging the pseudo-replicates before analyzing the data). If your experimental design includes pseudo-replicates, be sure to understand how they differ from standard replicates and take appropriate action to account for them in your analysis.
Matched values are spread across a row
The experiment was done with six animals, two for each dose. The control values were measured first in all six animals. Then you applied a treatment to all the animals and made the measurement again. In the table above, the value at row 1, column A, Y1 (23) came from the same animal as the value at row 1, column B, Y1 (28). The matching is by row.
Matched values are stacked into a subcolumn
The experiment was done with four animals. First each animal was exposed to a treatment (or placebo). After measuring the baseline data (dose=zero), you inject the first dose and make the measurement again. Then inject the second dose and measure again. The values in the first Y1 column (23, 34, and 43) were repeated measurements from the same animal. The other three subcolumns came from three other animals. The matching was by column.
When each subcolumn represents an animal or participant, Prism lets you label the subcolumns on the data table. Simply double click on the subcolumn heading (A:Y1).
Repeated measures in both factors
The experiment was done with two animals. First you measured the baseline (control, zero dose). Then you injected dose 1 and made the next measurement, then dose 2 and measured again. Then you gave the animal the experimental treatment, waited an appropriate period of time, and made the three measurements again. Finally, you repeated the experiment with another animal (Y2). So a single animal provided data from both Y1 subcolumns (23, 34, 43 and 28, 41, 56).
When each subcolumn represents an animal or participant, Prism lets you label the subcolumns on the data table. Simply double click on the subcolumn heading (A:Y1).
When do you specify which design applies to this experiment?
The example above shows that one grouped data set can represent four different experimental designs. You do not distinguish these designs when creating the data table. The data table doesn't "know" whether or not the data are repeated measures. You should take into account experimental design when choosing how to graph the data. And you must take it into account when performing two-way ANOVA. On the first tab of the two-way ANOVA dialog, you'll designate the experimental design.
Lingo: "Repeated measures" vs. "randomized block" experiments
The term repeated measures is appropriate when you made repeated measurements from each subject.
Some experiments involve matching but not repeated measurements. The term randomized-block describes these kinds of experiments. For example, imagine that the three rows were three different cell lines. All the Y1 data came from one experiment, and all the Y2 data came from another experiment performed a month later. The value at row 1, column A, Y1 (23) and the value at row 1, column B, Y1 (28) came from the same experiment (same cell passage, same reagents). The matching is by row.
Randomized block data are analyzed identically to repeated-measures data. Prism always uses the term repeated measures, so you should choose repeated measures analyses when your experiment follows a randomized block design.
Run the ANOVA
1.From the data table, click  on the toolbar.
2.Choose Two-way ANOVA from the list of grouped analyses.
3.On the first tab (RM Design) choose your experimental design.
4.On the second (RM Analysis) tab, choose whether you want to run repeated measures ANOVA or a mixed model.
5. On the third (Factor Names) tab, optionally name the grouping variables that define the rows and columns. For the example shown above, you might label the columns as "treatment" and the rows as "dose". Each matched set might be named "animal".
6.On the fourth (Multiple Comparisons) tab, select your goal (if any) for multiple comparisons.
7.On the fifth (Options) tab, choose the details of which multiple comparisons test you want.
8.On the last (Residuals) tab, choose if and how you want to plot residuals, and if you want to test them for normality and equal variability (homoscedasticity).
Graphing data for two-way repeated measures ANOVA
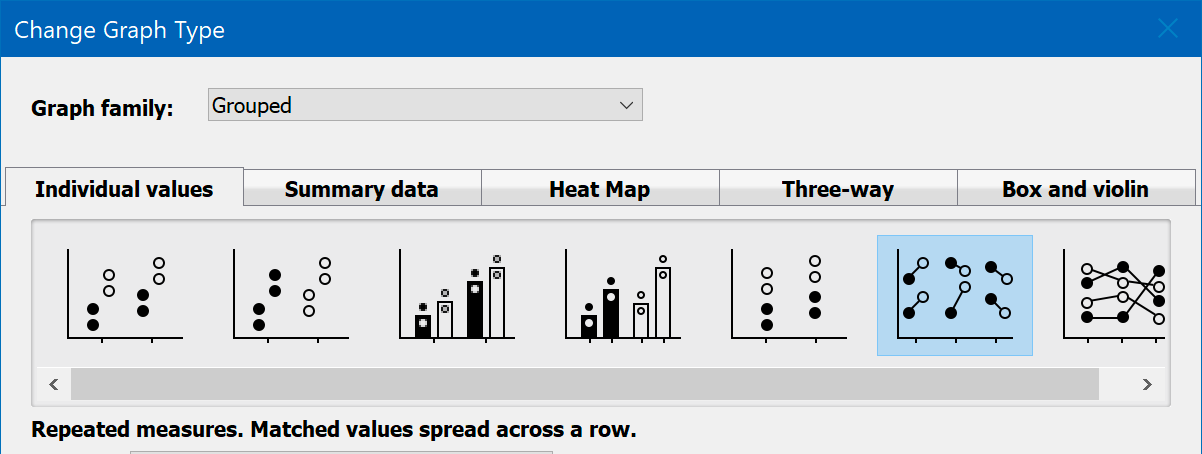
When graphing data with repeated measures, choose a graph that connects symbols representing individual points so the graph shows the nature of the data. To do this, choose the "individual values" tab of the New Graph dialog, and then choose one of the two graph types on the right. The example below shows the graph to choose if matched values are spread across a row. The next graph to the right is for when matched values are stacked. If you have matching in both direction, you need to choose which to plot as no graph (in Prism anyway) can show matching in both grouping variables.
Prism can't run repeated measures two-way ANOVA with huge data sets
Prism cannot run repeated measures two-way ANOVA with huge data sets and presents an message telling you so. How huge is huge? Really big!
Each column represents a different time point, so matched values are spread across a row
Prism cannot analyze tables where: (number of rows)2 * number of columns * number of subcolumns * (number of columns + number of subcolumns) > 268,435,456
Each row represents a different time point, so matched values are stacked into a subcolumn
Prism cannot analyze tables where: number of rows * (number of columns)2 * number of subcolumns * (number of rows + number of subcolumns) > 268,435,456
Repeated measures by both factors
Prism can handle any table you can enter.