The format of a Prism data table determines what kinds of graphs you can make and what kind of analyses you can perform. Choosing a data table format lets Prism create a data table that fits your data and makes it easy to create the kind of graph you want and perform the appropriate analyses. You can always change the format of a data table.
The eight kinds of data tables
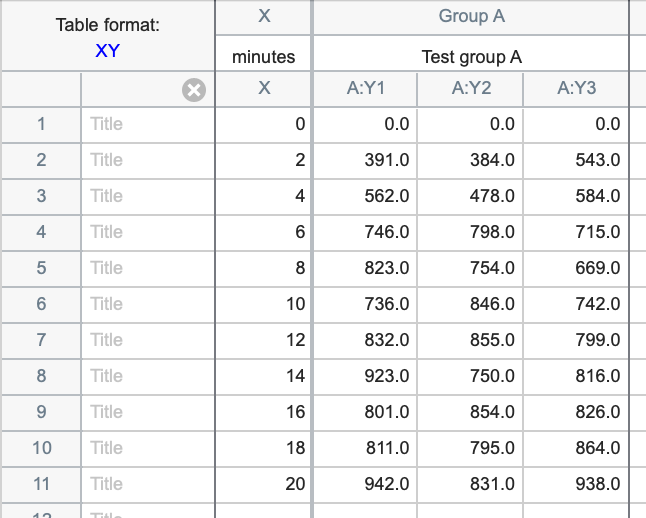
XY tables - An XY table is a graph where every point is defined by both an X and a Y value. This kind of data are often fit with linear or nonlinear regression.
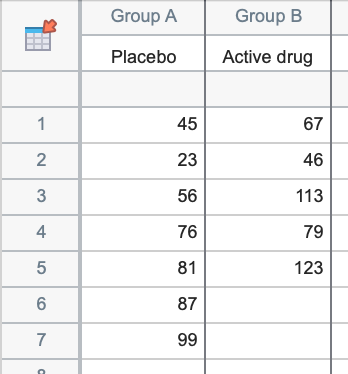
Column tables - Use column tables if your groups are defined by one grouping variable, perhaps control vs. treated, or placebo vs. low-dose vs. high-dose. Each column defines one group within the same grouping variable.
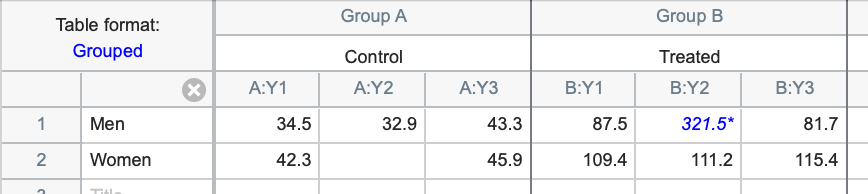
Grouped tables - Grouped data tables are similar to Column data tables, but are designed for two grouping variables. This is best understood by example. Groups (or levels) of one grouping variable are defined by rows (Men and Women in the example below); the groups (levels) of the other grouping variable are defined by columns (Control and Treated in the example below).
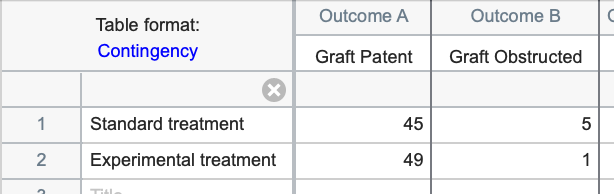
Contingency tables - Contingency tables - like Grouped data tables - are also designed for data described by two grouping variables. However, these tables are used to tabulate the actual number of subjects (or observations) that belong to each of the groups defined by the rows and columns. For example, with two rows and two columns as shown below there are four total groups: 1) Standard treatment and Graft Patent, 2) Standard treatment and Graft Obstructed, 3) Experimental treatment and Graft Patent, 4) Experimental treatment and Graft Obstructed.
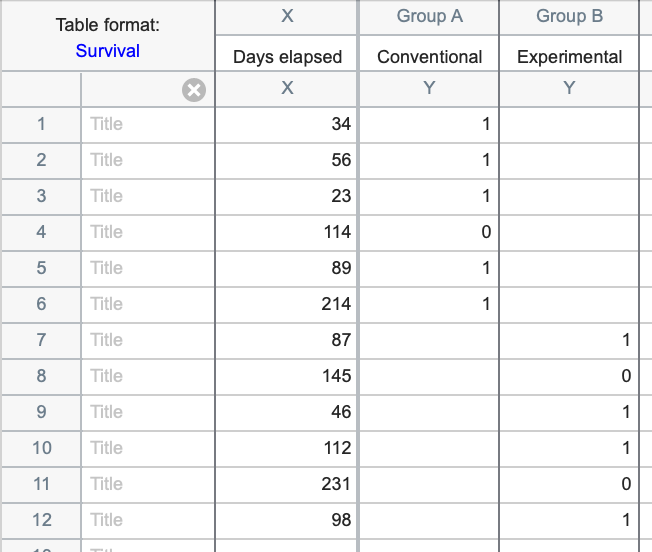
Survival tables - Survival tables are used to perform survival analysis using the Kaplan-Meier method. Each row represents a different subject or individual. The X column is used to enter elapsed survival time, while the Y columns are used to enter the outcome (event or censored) for different groups of a single grouping variable. In the example below, the groups are a "Conventional" treatment group and an "Experimental" treatment group. Prism automatically plots a Kaplan-Meier survival curve and compares survival between groups using the log-rank and Gehan-Wilcoxon tests. Prism can also perform survival analysis using Cox proportional hazards regression, but this is done using the Multiple variables data table (see below).
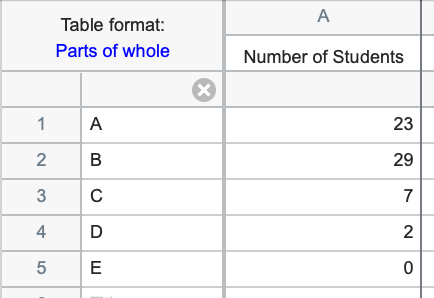
Parts of whole tables - A Parts of whole table is used when it makes sense to ask: What fraction of the total is each value? This table is often used to make a pie chart. The example below shows the number of students who received grades of A, B, C, etc. The sum of the five values in the table (61) is the total number of students.
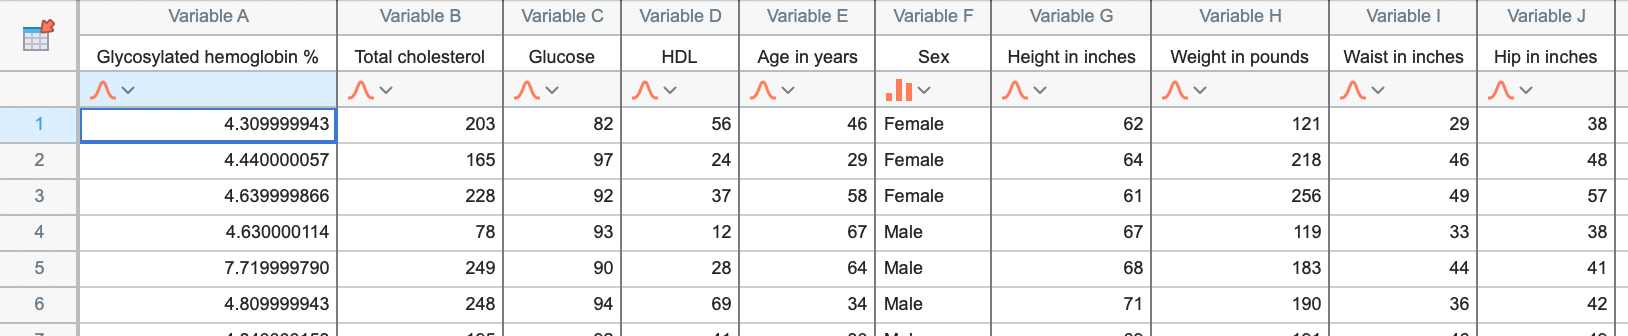
Multiple variables tables. A multiple variables data table is arranged the same way most statistics programs organize data. Each row is a different observation or "case" (experiment, animal, etc.). Each column is a different variable. Additionally, variables can be identified as either a continuous variable, a categorical variable, or a label variable, while values for categorical and label variables can be entered as text ("Female" and "Male" in the example below).
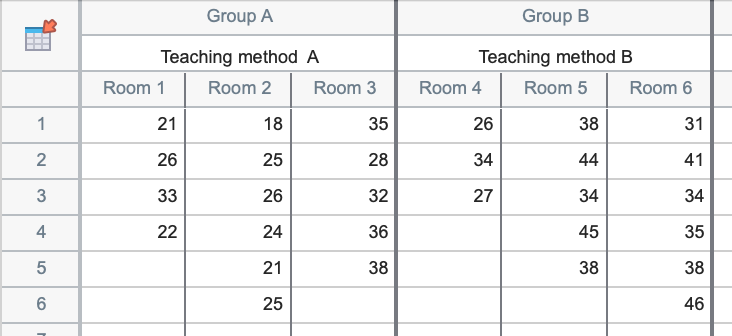
Nested tables. A nested table is used when there are two levels of nested or hierarchical replication. In this example, two teaching methods are being compared. The teaching methods are each used in three separate classrooms, and there are between three and six students in each room. The values in the data table represent the measured scores for individual students in each classroom. Since each room only uses one teaching method, it is said that the room variable is "nested" within the teaching method variable.