
How does Prism compute confidence and prediction bands for nonlinear regression or linear regression?
How to plot prediction or confidence bands
When Prism fits a line or curve with linear or nonlinear regression, it can superimpose on your graph either confidence or prediction bands. With linear regression, this is a choice on the dialog. For nonlinear regression, it is a choice on the Diagnostics tab of the nonlinear regression dialog.
How to plot both confidence and prediction bands on one graph.
How to view the coordinates of the bands.
One-sided confidence or prediction bands
The difference between confidence and prediction bands
Note the difference between confidence and prediction bands:
- The 95% confidence bands enclose the area that you can be 95% sure contains the true curve. If you have many data points, the confidence bands will be near the line or curve, and most of your data will lie outside the confidence bands.
- The 95% prediction bands enclose the area that you expect to enclose 95% of future data points. They are wider than confidence bands -- much wider with large data sets.
Note the distinction between the 95% confidence interval of the parameters, which Prism also computes, and the 95% confidence bands around the curve.
How confidence and prediction bands are computed
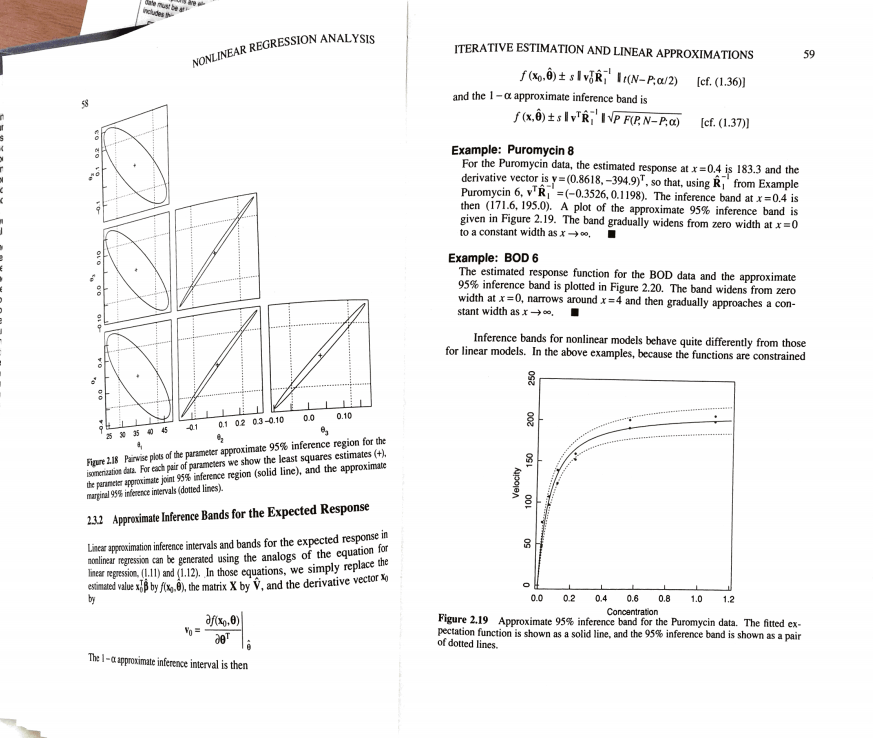
The calculation of the confidence and prediction bands are fairly standard. For linear regression, this page explains the details. Read on for a brief explanations of how Prism computes prediction and confidence bands of nonlinear regression. Or read this alternative, well-written mathematical explanation. We learned about this method from Bates and Watts pages 58-59 (see amazon book link below; scan of page 58-59)
First, let's define G|x, which is the gradient of the parameters at a particular value of X and using all the best-fit values of the parameters. The result is a vector, with one element per parameter. For each parameter, it is defined as dY/dP, where Y is the Y value of the curve given the particular value of X and all the best-fit parameter values, and P is one of the parameters.)
G'|x is that gradient vector transposed, so it is a column rather than a row of values.
Cov is the covariance matrix (inversed Hessian from last iteration). It is a square matrix with the number of rows and columns equal to the number of parameters. Each item in the matrix is the covariance between two parameters. Note that this is the actual covariance matrix, which is distinct from the normalized covariance matrix (where each value is between -1 and 1) that Prism can report. Normalized vs. nonnormalized covariance matrix.
Now compute c = G'|x * Cov * G|x. The result is a single number for any value of X.
The confidence and prediction bands are centered on the best fit curve, and extend above and below the curve an equal amount.
The confidence bands extend above and below the curve by:
= sqrt(c)*sqrt(SS/DF)*CriticalT(Confidence%, DF)
The prediction bands extend a further distance above and below the curve, equal to:
= sqrt(c+1)*sqrt(SS/DF)*CriticalT(Confidence%, DF)
In both these equations, the value of c (defined above) depends on the value of X, so the confidence and prediction bands are not a constant distance from the curve. The value of SS is the sum-of-squares for the fit, and DF is the number of degrees of freedom (number of data points minus number of parameters). CriticalT is a constant from the t distribution based on the amount of confidence you want and the number of degrees of freedom. For 95% limits, and a fairly large df, this value is close to 1.96. If DF is small, this value is higher.
Situations where Prism won't plot confidence or prediction bands
Prism will not plot confidence or prediction bands in several situations:
- If the best-fit value of a parameter hit a constraint, the fit is unlikely to be useful. Prism does not plot confidence or prediction bands, because they would almost certainly be misleading.
- If the results of nonlinear regression are ambiguous, the confidence or prediction bands would be super wide, maybe infinitely wide. They would not be useful, so Prism does not plot them.
- If you choose robust nonlinear regression, Prism does not compute confidence or prediction bands, as it cannot compute standard errors or confidence intervals of the parameters.
- The fit is perfect. If the sum-of-squares is 0.0 and R2 is 1.0, it is not possible to compute or interpret confidence or prediction bands.
- If the fit is interrupted, confidence and prediction bands are not computed.
- If you chose to weight the fit by 1/SD2. To plot confidence and prediction bands, Prism needs to know the weighting factor at every X value in the range it plots the curve. Not a problem with most weighting schemes. But if you weight by the values you enter in the SD column, then Prism only knows those weights, and not the weights for X values between the points, so can't plot confidence or prediction bands.