The data
To begin, we’ll want to create a new multiple variables data table from the Welcome dialog.
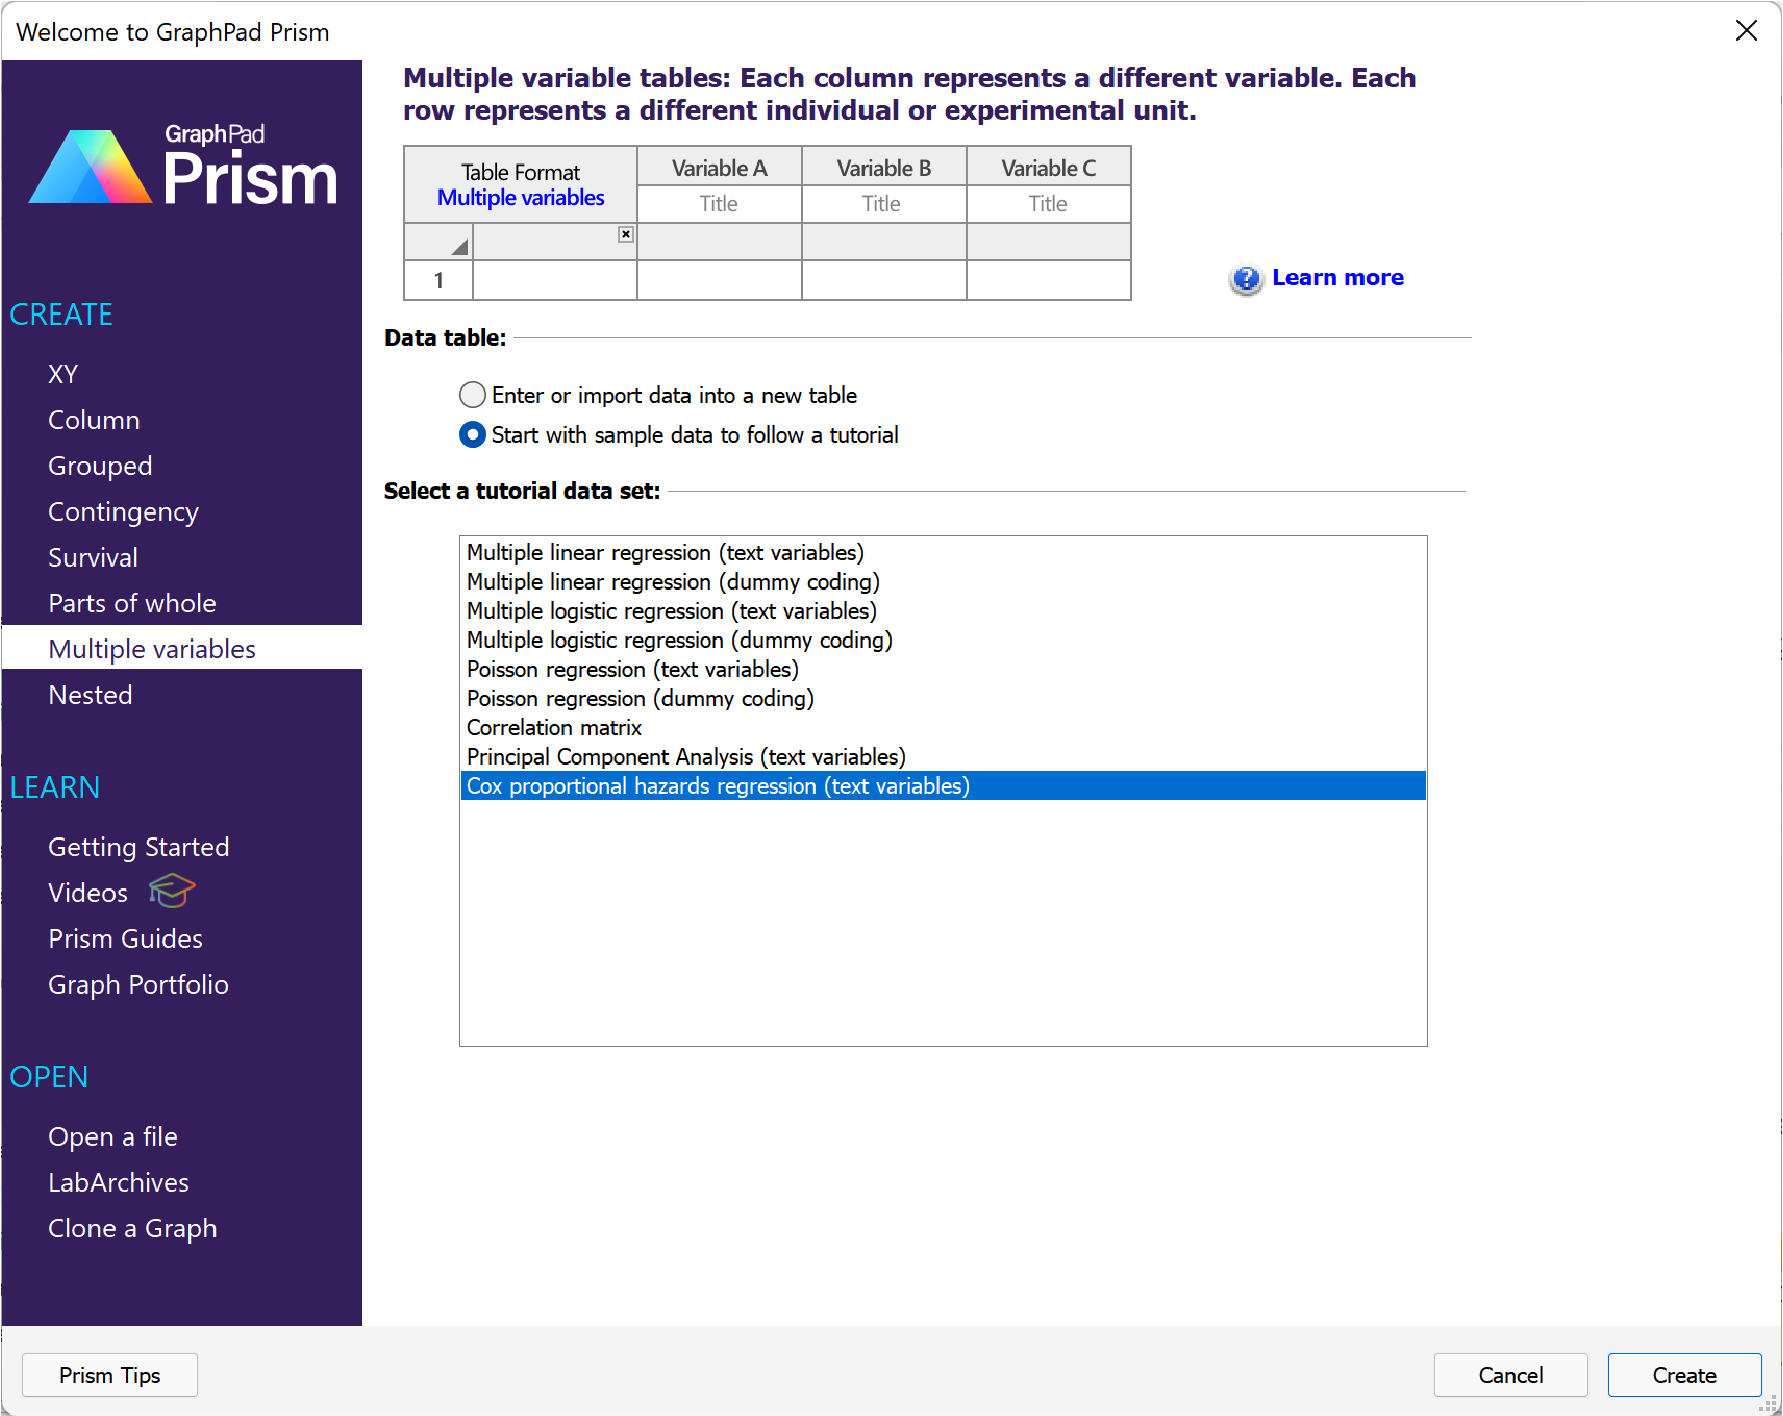
Choose the Cox proportional hazards regression sample data found in the list of tutorial data sets for the multiple variables data table. An excerpt of the data is shown below:
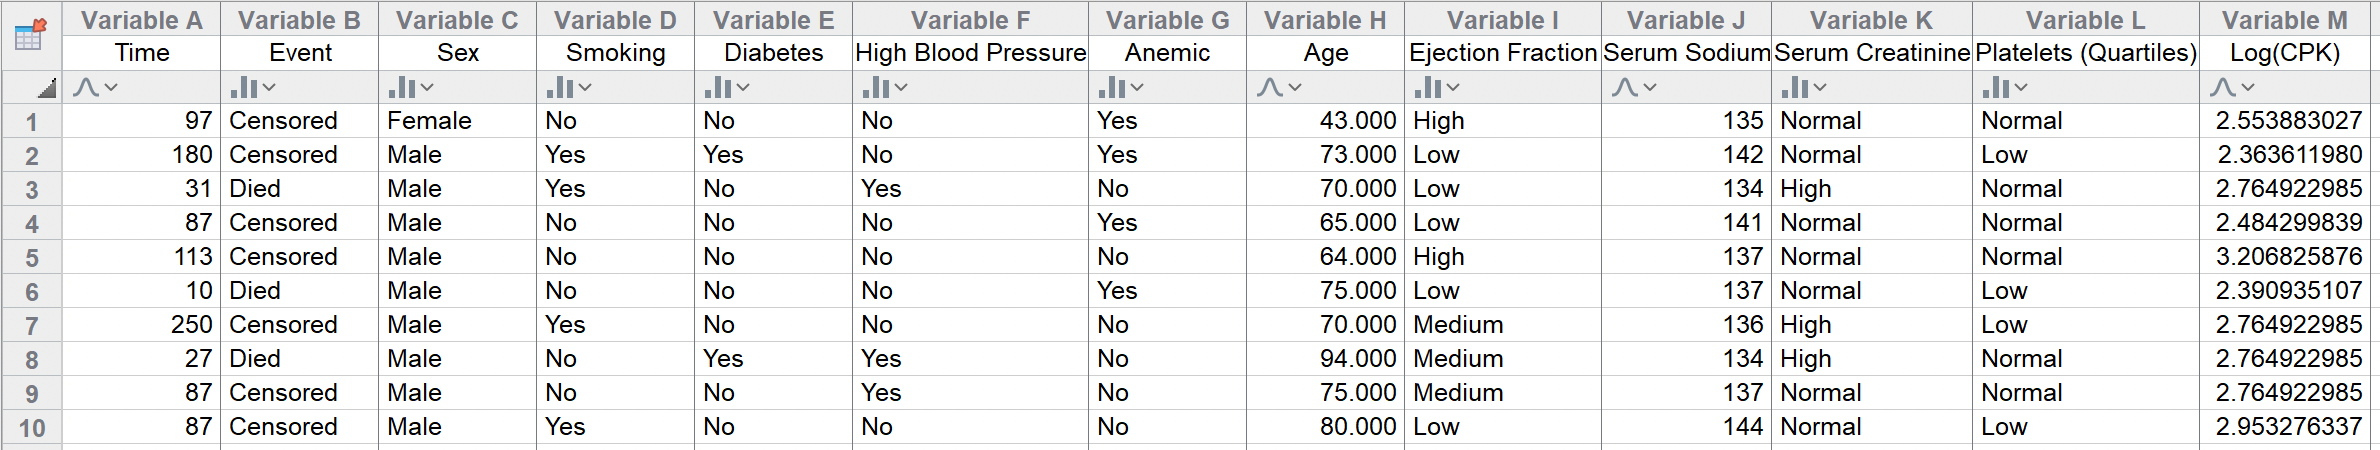
These data were published following a clinical study examining potential predictor variables for death due to coronary heart disease (CHD). This study included 299 participants (105 women and 194 men), with measurements for 11 different variables for each individual. In addition, this dataset includes an Event variable indicating for each participant whether they died due to CHD or were censored. Finally, the Time variable contains the elapsed survival time (elapsed time of observation) for each individual between their enrollment into the study and the time at which they either died or were censored.
There are three continuous variables in the dataset:
•Age (in years)
•Serum sodium level
•Creatinine phosphokinase level
There are eight categorical variables in the dataset:
•Sex [Male, Female]
•Smoking status [Yes, No]
•Diabetes status [Yes, No]
•High blood pressure [Yes, No]
•Anemia (measured as hematocrit levels less than 36) [Yes, No]
•Ejection fraction [Low, Medium, High]
•Serum creatinine levels [Normal, High]
•Platelet count [Low, Normal, High]
Using this data with Cox proportional hazards regression, we should be able to answer a number of questions, including:
•Does the specified model with selected predictor variables do a better job of estimating hazard rate/survival time than the null model (with no predictor variables)? Answer using the Model Diagnostics
•Do each of the predictor variables individually have an effect on the hazard rate/survival time for individuals in this population? Answer using the confidence intervals of Parameter estimates, Hazard Ratios, or the P values
•What is the effect on the hazard rate/survival time for different values (levels) of a given predictor variable? Answer using the Hazard Ratios
Initiating the analysis
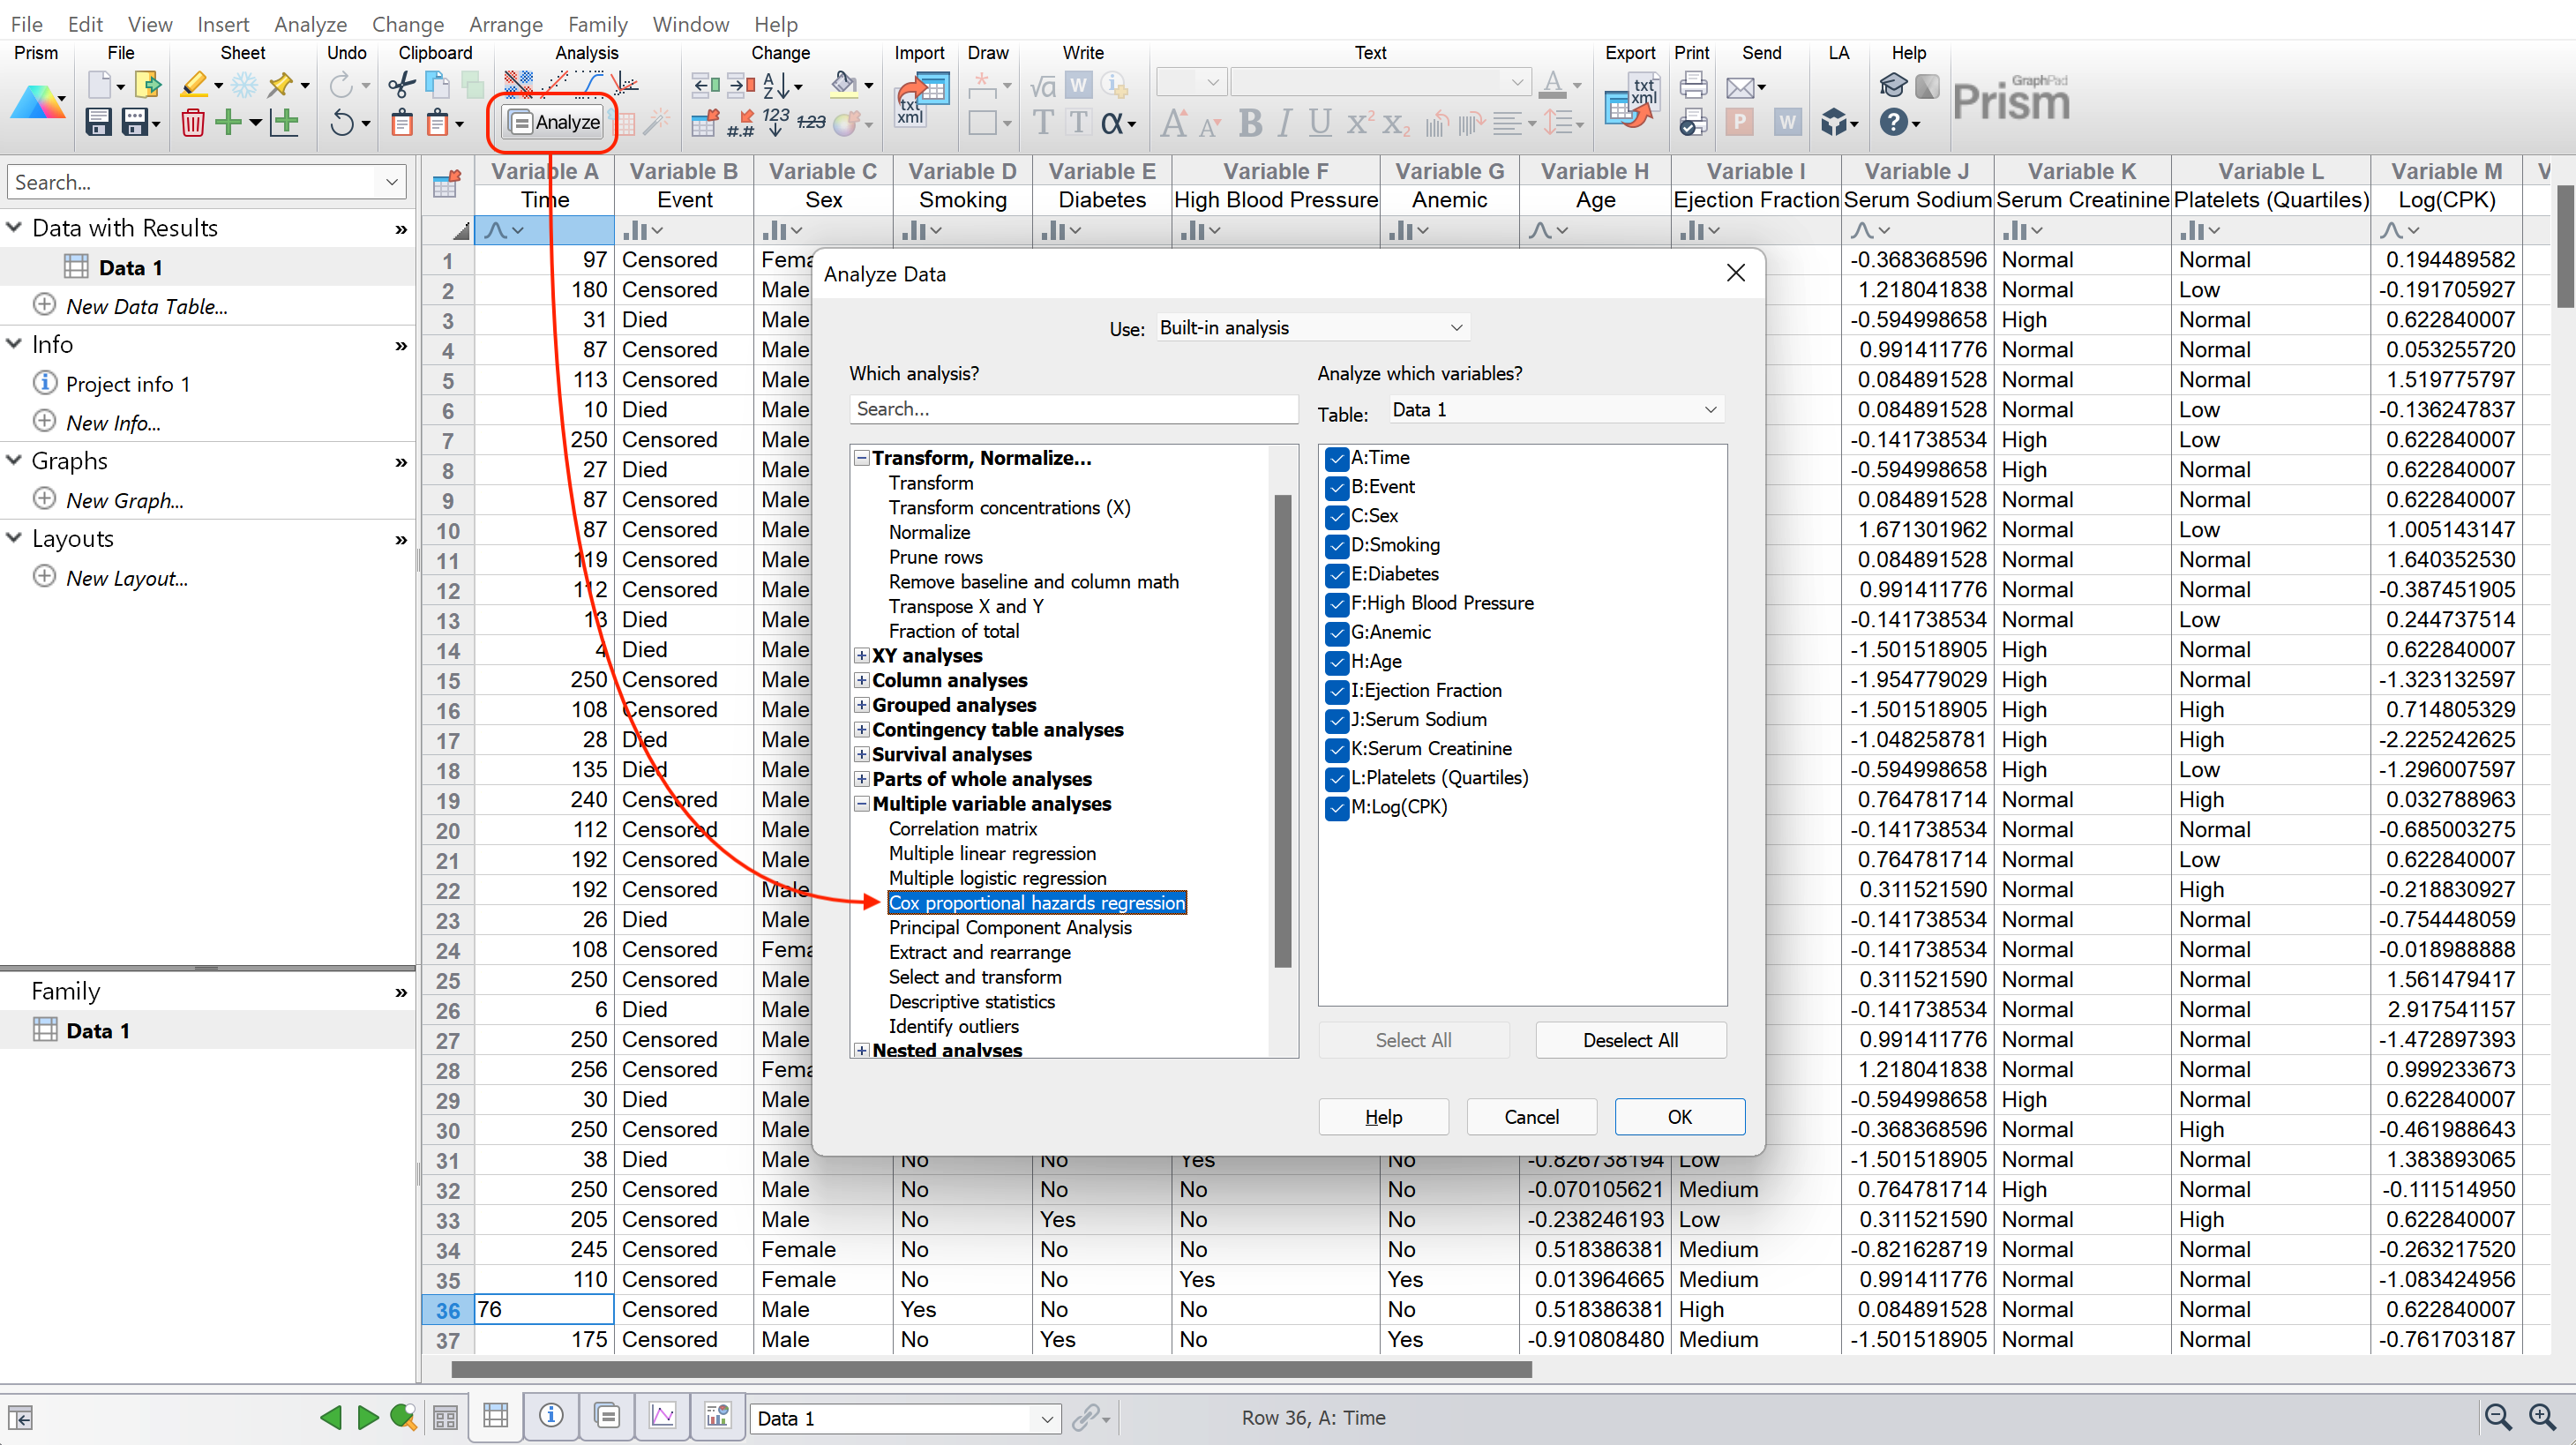
To start the analysis, click on the Analyze button in the “Analysis” section of the Toolbar, then select “Cox proportional hazards regression” from the list of available Multiple variable analyses. Alternatively, you can use the Analyze menu, and find “Cox proportional hazards regression” listed either under “Regression and curves” or “Survival analysis”.
 .
.
The analysis dialog
After selecting the analysis, the parameters dialog will appear. For the purposes of this example, we’re going to accept most of the default options that Prism provides. The results for the options selected here will be discussed briefly, but there are many more options available on each of the different tabs in the Parameters: Multiple Cox Regression dialog.
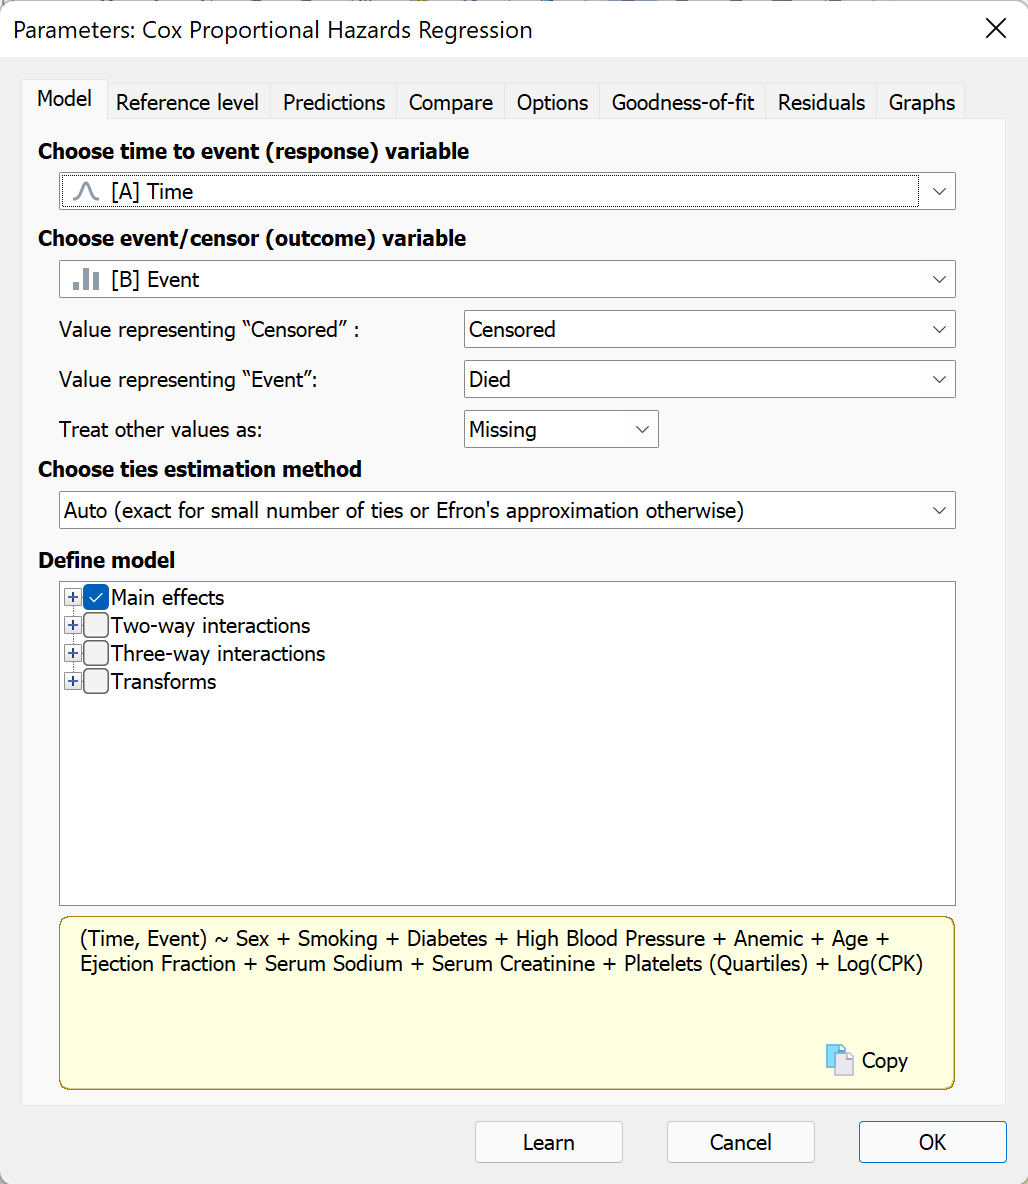
On the model tab of the dialog (shown above), you can see that Prism has already selected variables for the time to event (response) and outcome (event/censor) variables. Additionally, since the outcome variable (Event) was a categorical variable, we should verify that the correct levels were assigned to “Value representing ‘Censored’” and “Value representing ‘Event’”. In this case, these are also both correct. Expanding the “Main effects” section in “Define model” you can see that all predictor variables are included by default in the model (this is confirmed in the yellow text box at the bottom of the tab which provides a simple representation of the model to be performed).
Before we click “OK”, we will switch to the Graphs tab. The controls on this tab are used to generate estimated survival curves for different groups represented by the predictor variables in the specified model. The two sections of controls on this tab are used to:
1.Define the number of graphs that you would like to create
2.Specify the variables used to define the groups that Prism should generate estimated survival curves for on each graph
This page in the guide provides a complete example of how these controls can be used to generate a variety of different estimated survival curves. For the purposes of this example, let’s create a single graph, and add the following variables/values:
•High Blood Pressure (both levels “Yes” and “No”)
•Age (with a value of 40, the youngest age observed in the sample population)
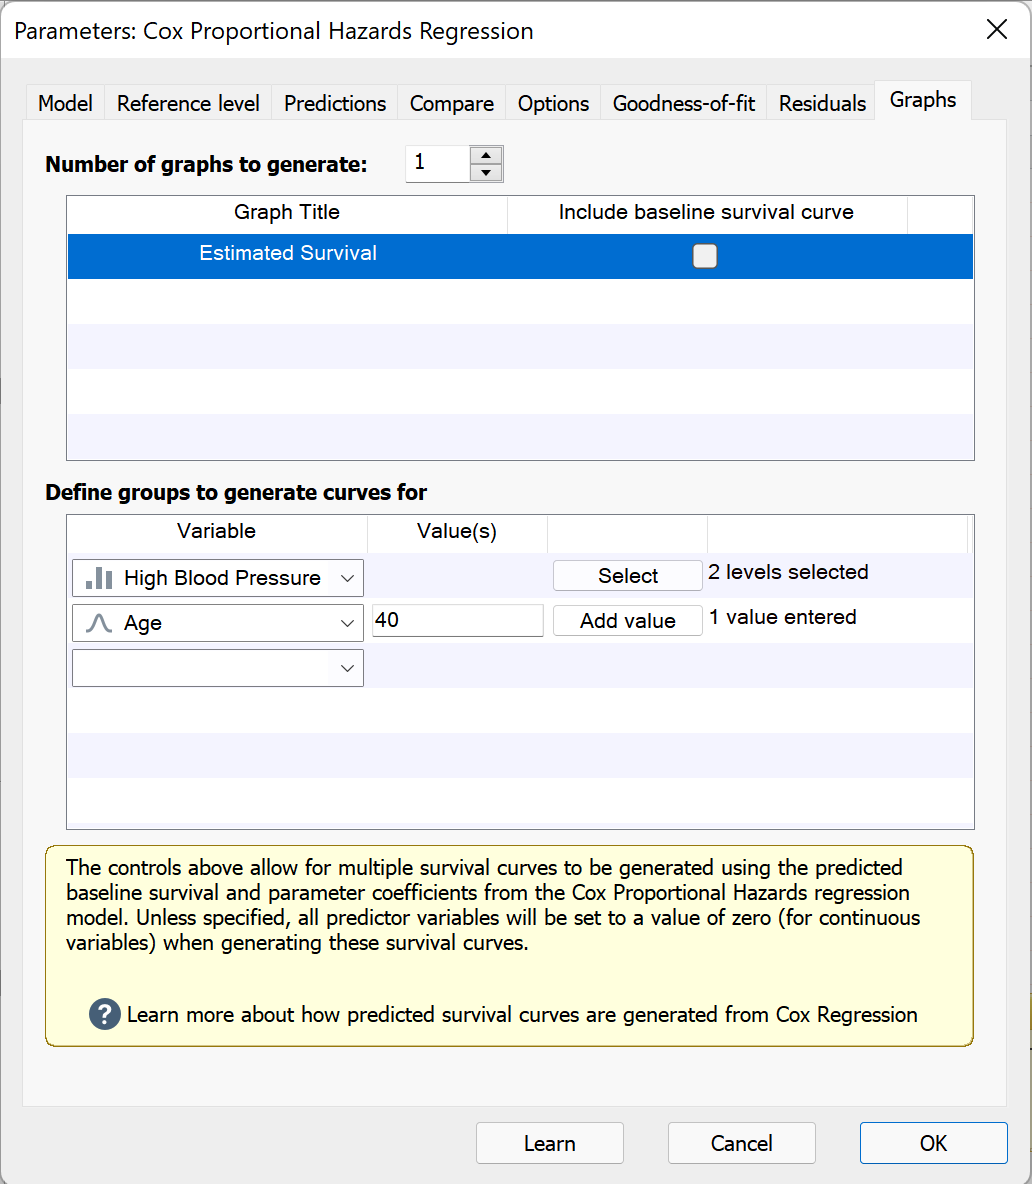
With those options set, we can click “OK”, and we’ll be taken to the results sheet which will be discussed on the next page.