




Creating a Grouped graph showing both individual points and bars
In Prism 8 and later, this is a built-in graph choice as shown below:

In Prism 7 and earlier, this choice was not offered with Grouped graphs, but it is easy to modify the graph.
First make a grouped graph showing symbols, and customize as needed to make it look good.

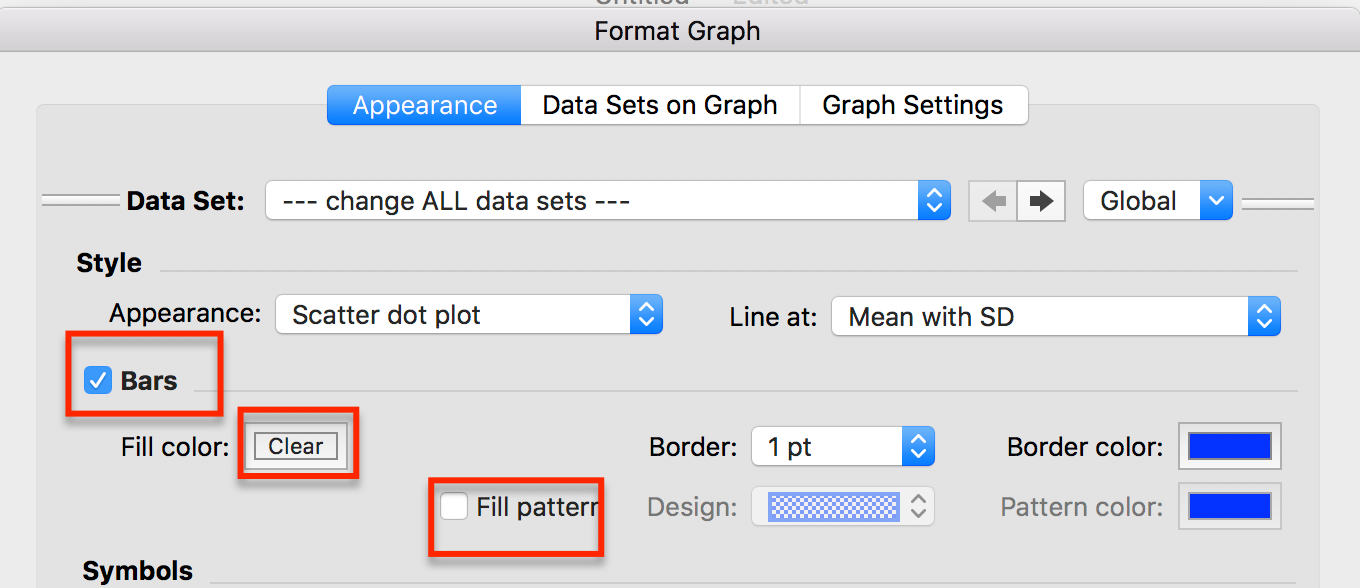
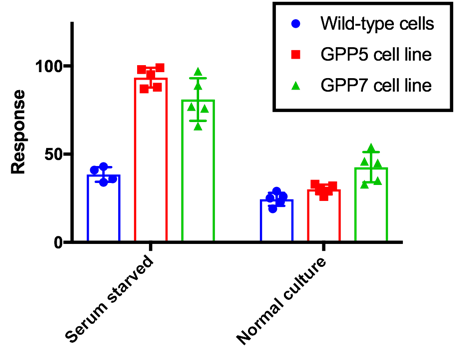
Double-click on the main part of the graph to bring up Format graph. Use the global selection at the upper left to change all data sets. Check the options to show bars, to make the bar interior clear, and uncheck the option for a fill pattern, That's it:
To control the front-back relationship of bars and points, you need to follow a trick. In the Format Graph dialog, switch to global mode, then uncheck the option to draw bars. Now the option at the bottom of the dialog "Line and error bars go" becomes available and can choose to put the bar and error bar on top, or underneath, the points. Then check the option again to draw the bars. Details here.
Keywords: grouped graph points bars dots error bar scatter plot