- Prism
FEATURES
Analyze, graph and present your workComprehensive analysis and statisticsElegant graphing and visualizationsShare, view and discuss your projectsLatest product features and releasesPOPULAR USE CASES
- Enterprise
- Resources
- Support
- Pricing
The preferred analysis and graphing solution purpose-built for scientific research. Join the world’s leading scientists and discover how you can use Prism to save time, make more appropriate analysis choices, and elegantly graph and present your scientific research.
Comprehensive Analysis and Powerful Statistics, Simplified
Work Smarter, Not Harder
The Fastest Way to Elegantly Graph and Share Your Work
Discover What’s New in Prism!
Introducing an even more powerful Prism featuring enhanced data visualization and graph customization, more intuitive navigation, and more sophisticated statistical analyses.
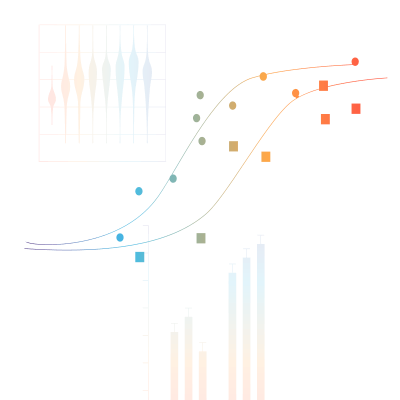
Enhanced Data Visualization and Graphs Customization
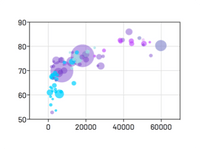
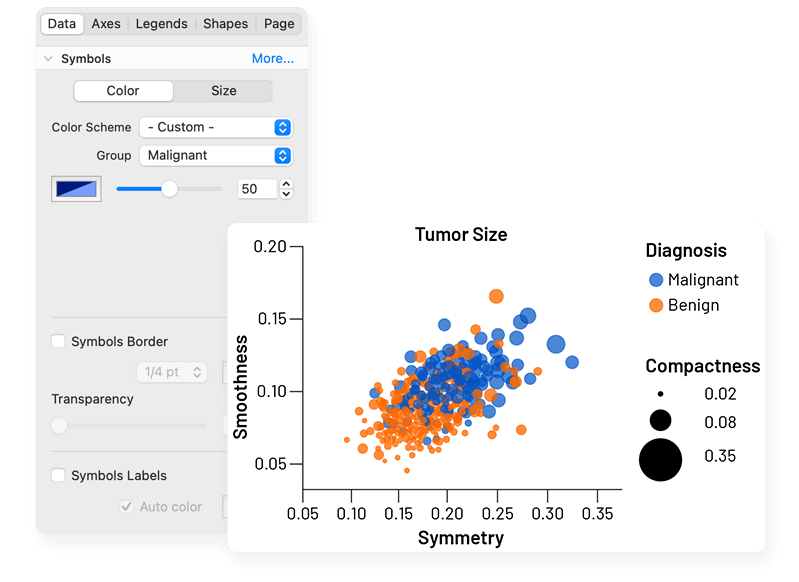
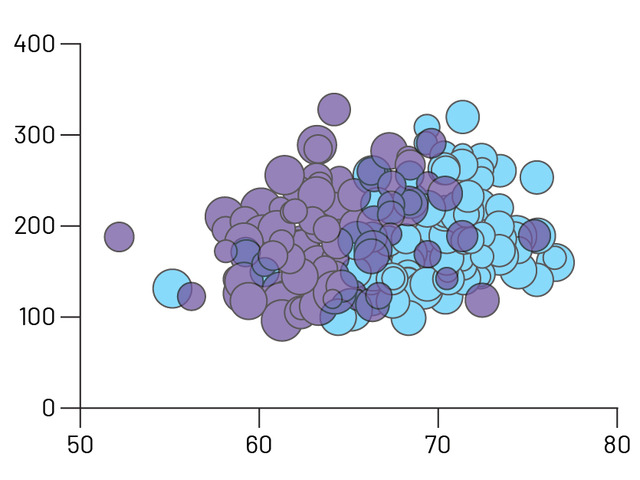
Bubble Plots
Create Bubble Plots directly from raw data, encoding variables for position (X- and Y-coordinates), color, and size
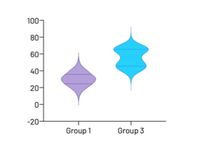
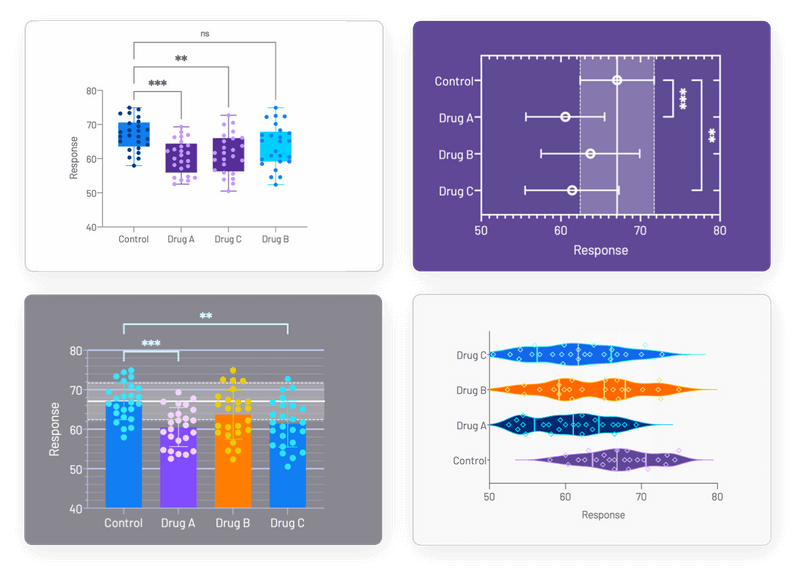
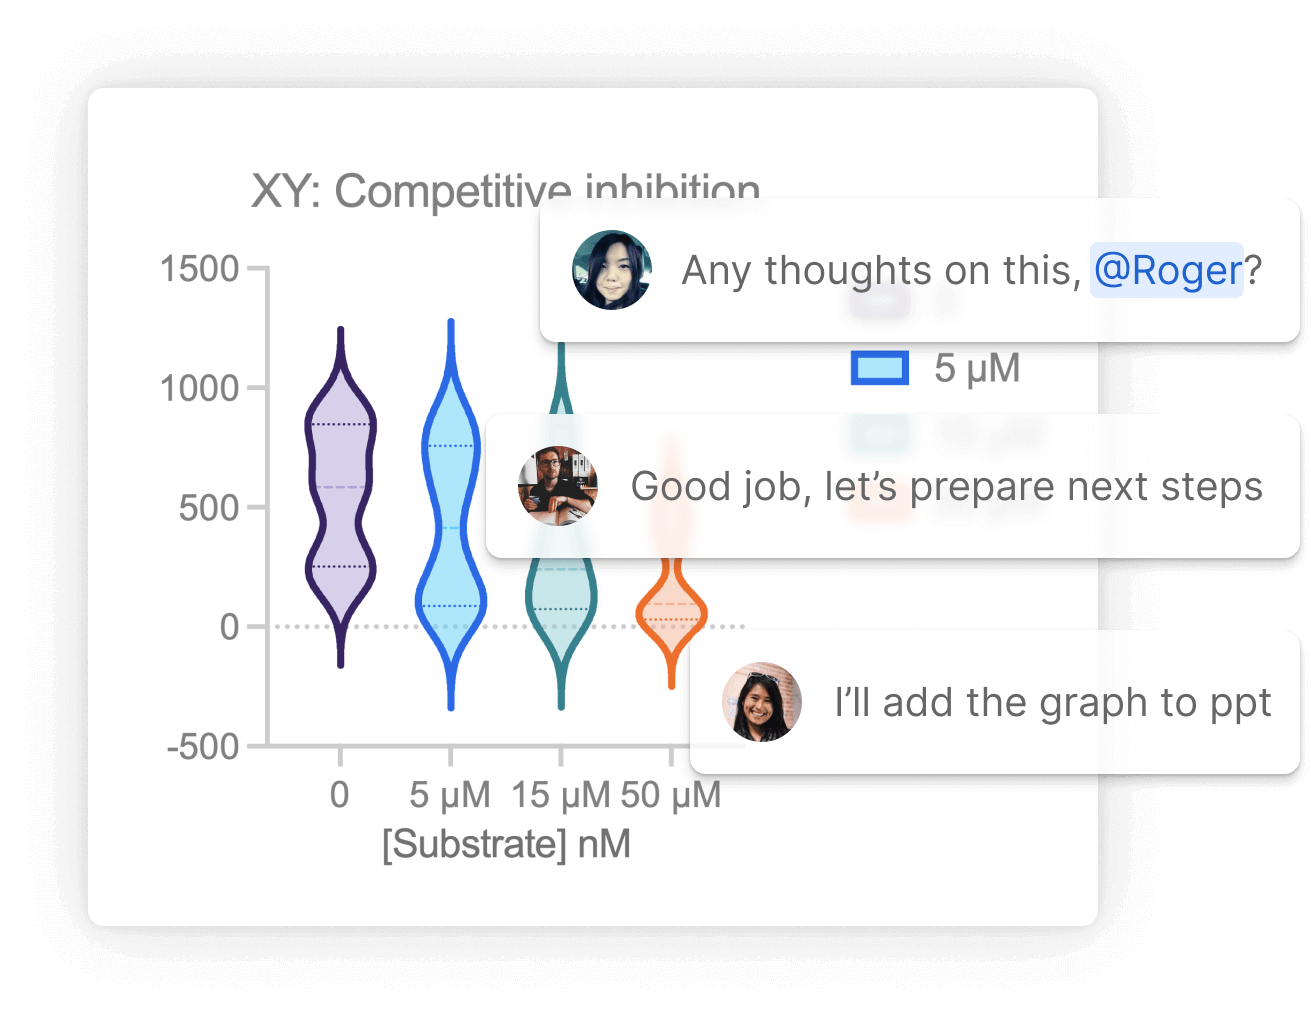
Violin plots
Visualize distributions of large data sets with either extended or truncated violin plots
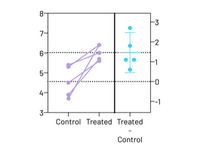
Estimation Plots
Automatically display your analysis results
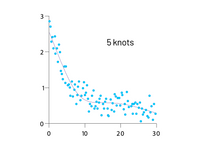
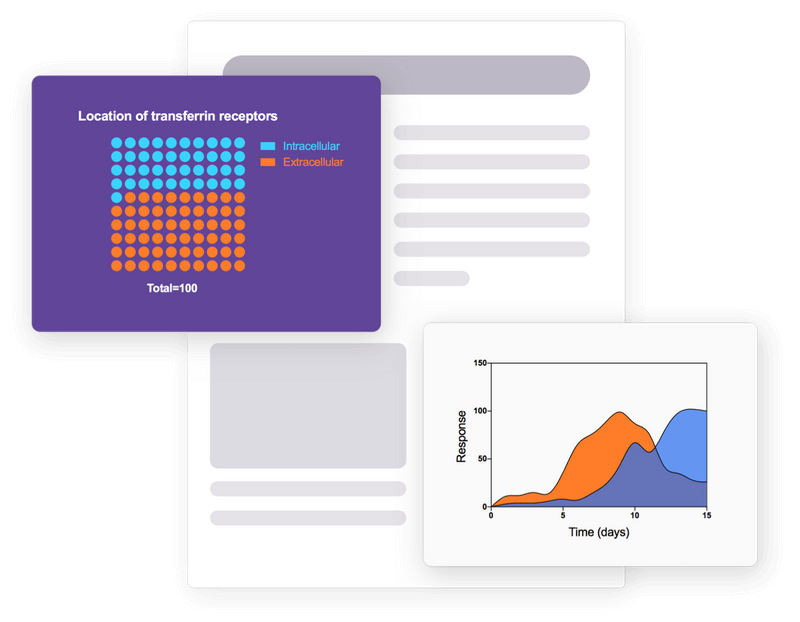
Smoothing spline
Major improvements in showing general data trends through Akima splines and smoothing splines with improved control over the number of knots, or inflection points
Improved Graphing and Customization Options
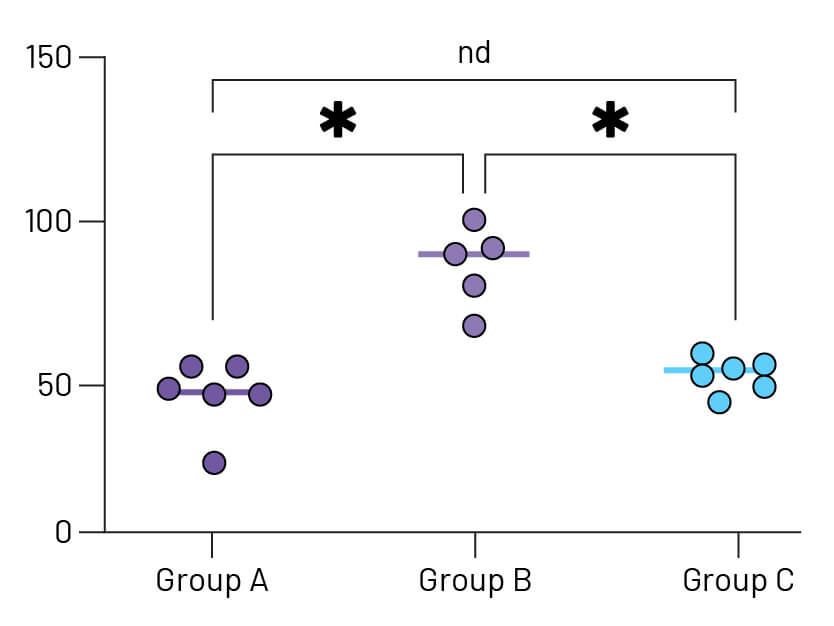
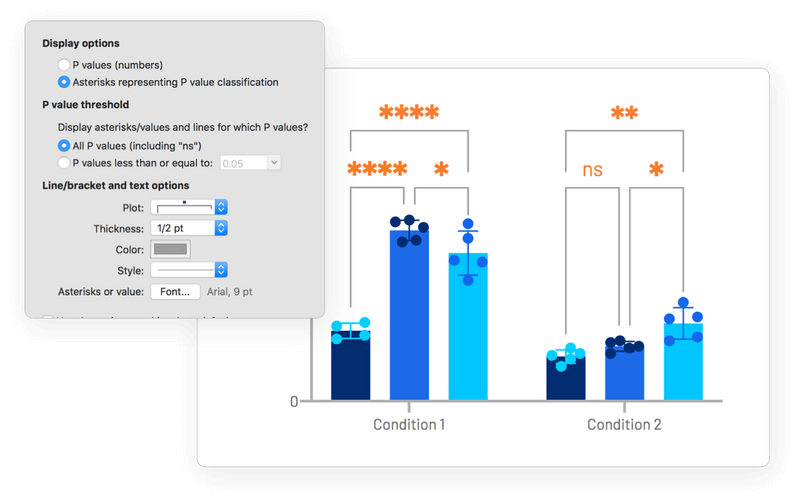
Stars on Graph
Automatically add multiple comparison results to graphs. Choose from a variety of P value summary styles including a responsive method appropriate for any alpha level
Improved Graph Customization
Craft stunning Bubble plots faster, easier, and more intuitively than before. Interact and customize graphs from your Multiple Variables data in real-time
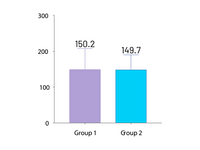
Automatically label bar graphs
Annotate your bar graphs with values for the means, medians, or sample sizes to emphasize what's important in your work
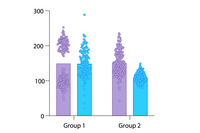
Improved grouped graphs
Easily create graphs that show both individual points (scatter) along with bars for mean (or median) and error bars
More Effective and Efficient Research
Greater Collaboration
Use Prism Cloud to avoid those messy email threads. Keep all of your discussions in one place while securely controlling who has access to your work
A More Open Access File Format
By using industry-standard formats (CSV, PNG, JSON, etc.), you can ensure that your projects can be utilized outside of Prism and open up new possibilities for your data workflows and integrations
Expanded Data Table Capabilities
You can have as many windows open as you need and data in up to 2048 columns, with 512 sub columns in each. Expanded analysis constant dialog allows you to link to more results for all types of analyses
Intelligent Data Wrangling
A new range of tools to help you prepare your Multiple Variables data for analysis. Transform data with spreadsheet-style formulas directly in the data table. Select specific data subsets using flexible criteria – by column, row range, or conditional rules. Or restructure data into one of Prism's other data table formats with full control over how variables map to the new structure.
Hook Constant Dialog Upgrade
A convenient way to establish connections between different elements in Prism. A new easy-to-navigate tree structure now covers the entire library of Prism analyses
Featuring Eight Kind of Data Tables
XY tables
Used when every data point is defined by a single X and Y value. These sorts of data are often fit with linear or nonlinear regression models.
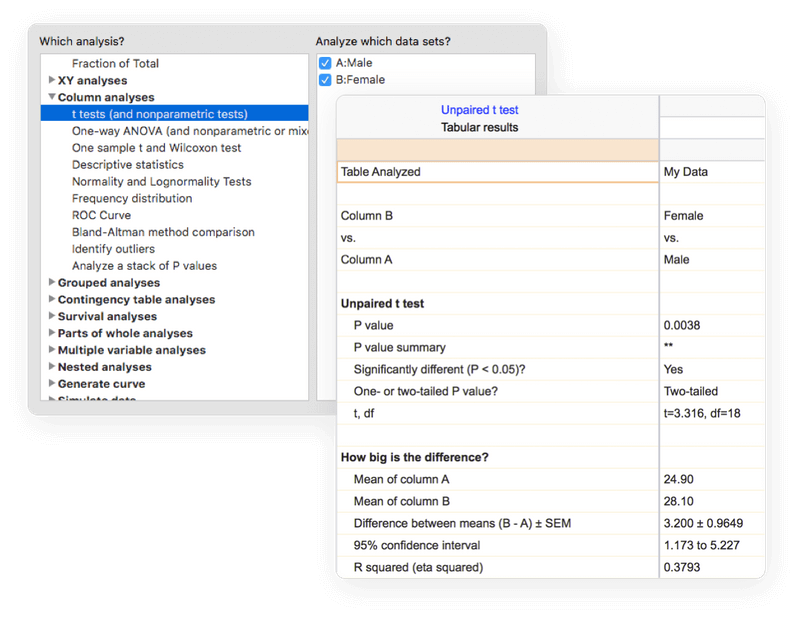
Column tables
Used for data organized into groups by a single grouping variable (for example Treatment vs. Control or Female vs. Male). Often analyzed using t tests and one-way ANOVA.
Grouped tables
Used for data organized into groups by two grouping variables (for example Female Control vs. Female Treatment vs. Male Control vs. Male Treatment). Often analyzed using two-way ANOVA.
Contingency tables
Used for count data organized into groups by two grouping variables (Treatment vs. Control and Positive vs. Negative Outcome). Appropriate for analysis by Chi-square and Fisher's exact test.
Survival tables
Used to perform Kaplan-Meier survival analysis. Each row represents a subject or individual with elapsed survival time and outcome.
Parts of whole tables
Used when it makes sense to ask: "What fraction of the total is each value in the table?". Used for calculating fractions and generating pie charts.
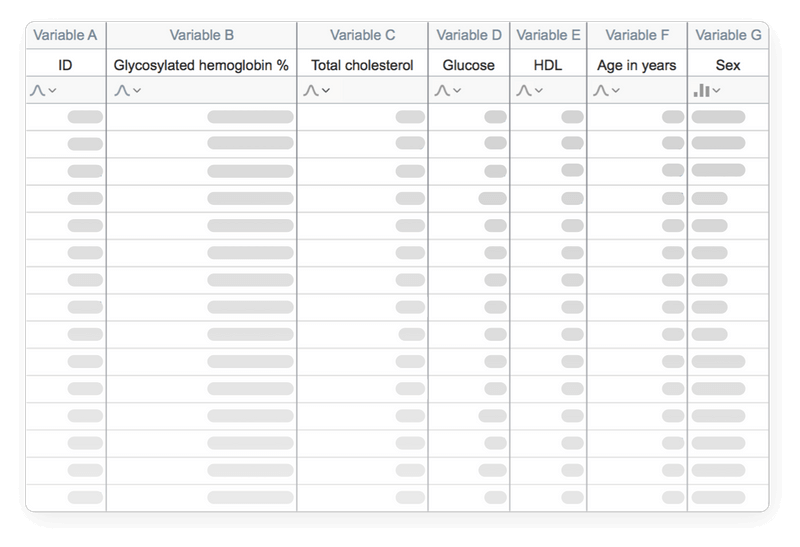
Multiple variables tables
Used when each row is an observation and each column is a variable. Supports both numeric and text values. Transform data with spreadsheet-style formulas directly in the table. Perform multiple linear regression, Cox regression, t-tests, nonlinear regression, survival analysis, and multifactor (N-way) ANOVA.
Nested tables
Used when the data are organized into hierarchical groups. Analyzed using nested t tests or nested one-way ANOVA.
More Sophisticated Statistical Analyses
Perform repeated measures ANOVA – even with missing data
Now Prism will automatically fit a mixed effects model to complete this analysis
Multifactor (N-way) ANOVA
Analyze experimental designs with any number of categorical grouping factors – from one-way ANOVA all the way up to N-way ANOVA. The Multiple Variables data table provides flexibility for data of any size and complexity, while drag-and-drop variable assignment makes analysis configuration simple and intuitive.
Perform simple and multiple logistic regression
Fit a model to a binary outcome (yes/no, win/lose, pass/fail) based on one predictor variable (simple logistic regression) or many predictor variables (multiple logistic regression)
Principal Component Analysis (PCA)
Calculate and select the principal components that describe the greatest amount of variance in your data. Choose from selection techniques including Parallel Analysis via Monte Carlo simulation, Eigenvalue threshold, Proportion of Variance threshold, and more
Multiple t test (and nonparametric) analyses
Perform multiple independent two-sample comparison tests simultaneously. Select from parametric/nonparametric tests, and specify if data are unpaired/paired
Analyze categorical variables with text in Multiple Linear and Multiple Logistic Regression
No coding required! Prism will automatically encode categorical variables and perform the analysis. Specify a reference and organize all levels of categorical variables in a model for clear, readable results
Interpolation from multiple linear and multiple logistic regression
Use the specified model to predict values for the dependent variable based on data in the data table or using theoretical values specified in the analysis
Start Free 30 Day Trial
No credit card required.
Discover the Breadth of Statistical Features Available in Prism
Statistical Comparisons
- Paired or unpaired t tests. Reports P values and confidence intervals.
- Automatically generate volcano plot (difference vs. P value) from multiple t test analysis.
- Nonparametric Mann-Whitney test, including confidence interval of difference of medians.
- Kolmogorov-Smirnov test to compare two groups.
- Wilcoxon test with confidence interval of median.
- Perform many t tests at once, using False Discovery Rate (or Bonferroni multiple comparisons) to choose which comparisons are discoveries to study further.
- Ordinary or repeated measures ANOVA followed by the Tukey, Newman-Keuls, Dunnett, Bonferroni or Holm-Sidak multiple comparison tests, the post-test for trend, or Fisher’s Least Significant tests.
- One-way ANOVA without assuming populations with equal standard deviations using Brown-Forsythe and Welch ANOVA, followed by appropriate comparisons tests (Games-Howell, Tamhane T2, Dunnett T3)
- Many multiple comparisons test are accompanied by confidence intervals and multiplicity adjusted P values.
- Greenhouse-Geisser correction so repeated measures one-, two-, and three-way ANOVA do not have to assume sphericity. When this is chosen, multiple comparison tests also do not assume sphericity.
- Kruskal-Wallis or Friedman nonparametric one-way ANOVA with Dunn's post test.
- Fisher's exact test or the chi-square test. Calculate the relative risk and odds ratio with confidence intervals.
- Two-way ANOVA, even with missing values with some post tests.
- Two-way ANOVA, with repeated measures in one or both factors. Tukey, Newman-Keuls, Dunnett, Bonferroni, Holm-Sidak, or Fisher’s LSD multiple comparisons testing main and simple effects.
- Three-way ANOVA (limited to two levels in two of the factors, and any number of levels in the third).
- Analysis of repeated measures data (one-, two-, and three-way) using a mixed effects model (similar to repeated measures ANOVA, but capable of handling missing data).
- Comparison of data from nested data tables using nested t test or nested one-way ANOVA (using mixed effects model).
- Multifactor ANOVA for any number of factors with comprehensive effect size reporting.
- Comprehensive reporting for ANOVA, contingency table analyses, and t tests – including effect sizes as well as confidence intervals.
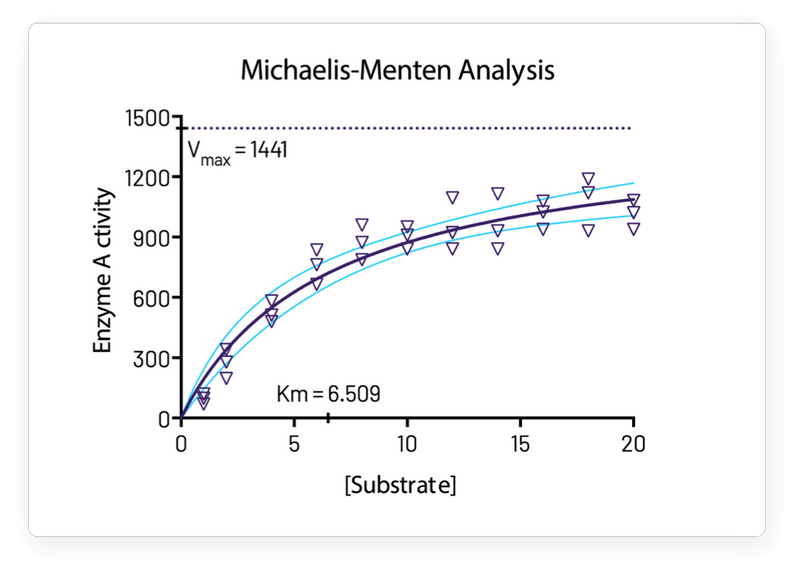
Nonlinear Regression
- Fit one of our 105 built-in equations, or enter your own. Now including family of growth equations: exponential growth, exponential plateau, Gompertz, logistic, and beta (growth and then decay).
- Enter differential or implicit equations.
- Enter different equations for different data sets.
- Global nonlinear regression – share parameters between data sets.
- Robust nonlinear regression.
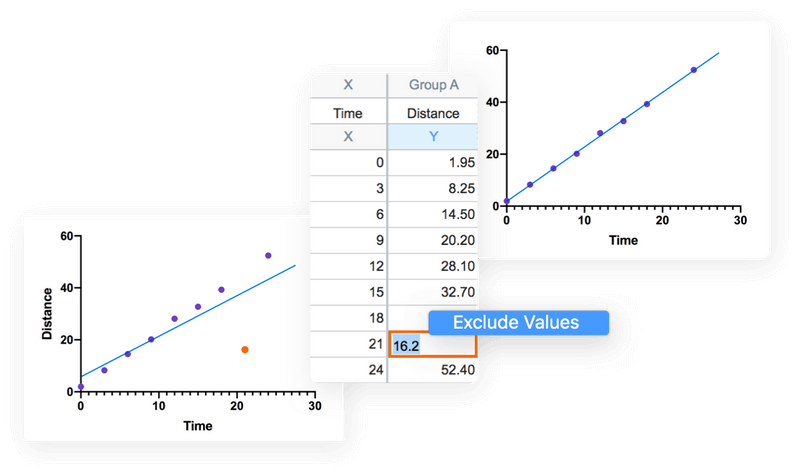
- Automatic outlier identification or elimination.
- Compare models using extra sum-of-squares F test or AICc
- Compare parameters between data sets.
- Apply constraints.
- Differentially weight points by several methods and assess how well your weighting method worked.
- Accept automatic initial estimated values or enter your own.
- Automatically graph curve over specified range of X values.
- Quantify precision of fits with SE or CI of parameters. Confidence intervals can be symmetrical (as is traditional) or asymmetrical (which is more accurate).
- Quantify symmetry of imprecision with Hougaard’s skewness.
- Plot confidence or prediction bands.
- Test normality of residuals.
- Runs or replicates test of adequacy of model.
- Report the covariance matrix or set of dependencies.
- Easily interpolate points from the best fit curve.
- Fit straight lines to two data sets and determine the intersection point and both slopes.
- Perform nonlinear regression from Multiple Variables tables with drag-and-drop assignment of independent (X), dependent (Y), and grouping variables.
Survival Analysis
- Kaplan-Meier survival analysis. Perform nonparametric survival analysis for different groups, and compare the estimated survival curves for each group with the log-rank test (including test for trend).
- Cox proportional hazards regression. Perform semi-parametric survival analysis that allows for the inclusion of additional continuous or categorical predictor variables (covariates). Automatically generate graphs of estimated survival curves for any set of predictor variable values.
- Perform survival analysis from Multiple Variables tables with flexible variable assignment.
Principal Component Analysis
- Component selection via Parallel Analysis (Monte Carlo simulation), Kaiser criterion (Eigenvalue threshold), Proportion of Variance threshold, and more.
- Automatically generated Scree Plots, Loading Plots, Biplots, and more.
- Use results in downstream applications like Principal Component Regression.
Multiple Variable Graphing
- Specify variables defining axis coordinates, color, and size.
- Create Bubble Plots.
Column Statistics
- Calculate descriptive statistics: min, max, quartiles, mean, SD, SEM, CI, CV, skewness, kurtosis.
- Mean or geometric mean with confidence intervals.
- Frequency distributions (bin to histogram), including cumulative histograms
- Normality testing by four methods (new: Anderson-Darling).
- Lognormality test and likelihood of sampling from normal (Gaussian) vs. lognormal distribution
- Create QQ Plot as part of normality testing.
- One sample t test or Wilcoxon test to compare the column mean (or median) with a theoretical value.
- Identify outliers using Grubbs or ROUT method.
- Analyze a stack of P values, using Bonferroni multiple comparisons or the FDR approach to identify "significant" findings or discoveries.
Simple Linear Regression and Correlation
- Calculate slope and intercept with confidence intervals.
- Force the regression line through a specified point.
- Fit to replicate Y values or mean Y.
- Test for departure from linearity with a runs test.
- Calculate and graph residuals in four different ways (including QQ plot).
- Compare slopes and intercepts of two or more regression lines.
- Interpolate new points along the standard curve.
- Pearson or Spearman (nonparametric) correlation.
Generalized Linear Models (GLMs)
- Generate models relating multiple independent variables to a single dependent variable using the new multiple variables data table.
- Multiple linear regression (when Y is continuous).
- Poisson regression (when Y is counts; 0, 1, 2, …).
- Logistic regression (when Y is binary; yes/no, pass/fail, etc.).
Clinical (Diagnostic) Lab Statistics
- Bland-Altman plots.
- Receiver operator characteristic (ROC) curves.
- Deming regression (type ll linear regression).
Simulations
- Simulate XY, Column or Contingency tables.
- Repeat analyses of simulated data as a Monte-Carlo analysis.
- Plot functions from equations you select or enter and parameter values you choose.
Other Calculations
- Area under the curve, with confidence interval.
- Transform data.
- Normalize.
- Identify outliers.
- Normality tests.
- Transpose tables.
- Subtract baseline (and combine columns).
- Compute each value as a fraction of its row, column or grand total.
Calculated Variables from In-table Formulas
- Create calculated variables with spreadsheet-style formulas directly in Multiple Variables tables. Just type "=" to begin.
- Calculated variables update automatically when source values change.
- Created variables can be used as independent, dependent, or grouped variables in analysis that work with Multiple Variables tables.
Prism is available on Mac and Windows.