
Fitting bacterial growth data to determine the MIC and NIC.
The MIC is the Minimum Inhibitory Concentration -- the smallest concentration of an antibiotic that 'completely' retards bacterial growth. The NIC is the smallest concentration of an antibiotic that slows bacterial growth. At concentrations below the NIC, growth occurs at a pace equal to the control. The definitions seems somewhat ad hoc, because it depends on how carefully you measure bacterial growth, and how you defined "completely retarding bacterial growth" and "slowing bacterial growth".
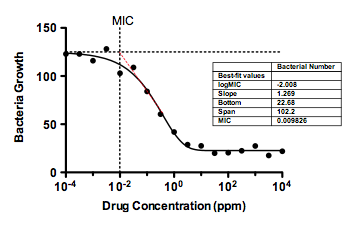
Lambert and Pearson (1) published one method for determining the NIC and MIC with nonlinear regression. They enter the data with X equal to the logarithm of concentration and Y proportional to number of bacterial. They then fit the data to a Gompertz model, to fit the bottom plateau (A), the span of the curve (C), the log of the inflection point (M) and a slope factor (B). They then define the MIC and NIC from the slope and inflection point in their equations 2 and 3. I adapted their equations to fit the MIC and NIC directly (and not to fit the inflection point. I changed the names of the parameters to be more descriptive,
This is one method of fitting the MIC. Frankly, I don't know if there are other methods. Please let me know if there are.
You can download this file, which fits sample data. It also draws a grid lines at the MIC and NIC (hooking the grid line position to an analysis constant fit by nonlinear regression). The graph also shows how he Lambert and Pearson method define the NIC and MIC: The intersection of the horizontal line at the top (or bottom) plateau of the curve (horizontal dotted) and the projection of the curve at the inflection point (red angled).
.png)
Simply replace the data with your own, and the fit will be automatic. You'll probably need to fuss with axis limits and graph appearance. Unless you are using Prism 4 or earlier, the dotted lines will automatically move to be correct for your data (they are grid lines hooked to analysis constants that change with new data). But the red line is simply hand-drawn, so will not move when you replace the data. Either remove the red line, or move it manually.
In this file, Prism fits the bottom plateau and span of the curve. If your data are normalized, you may want to constrain Bottom to equal 0.0 and maybe Span to equal 1.0 or 100.0.
Reference.
Lambert et al. Susceptibility testing: accurate and reproducible minimum inhibitory concentration (MIC) and non-inhibitory concentration (NIC) values. J Appl Microbiol (2000) vol. 88 (5) pp. 784-90. Pubmed