
Graph tip - Making time-lines
This example shows how make a time-line chart using a column or an XY graph. It also shows how to format grid lines and how to use axis label suffixes
How to do it:
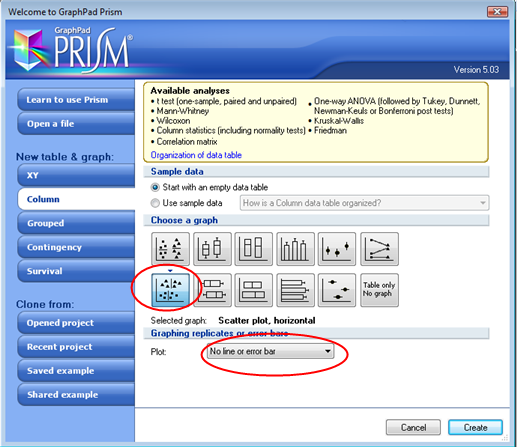
Start with a basic column data table and graph. Choose the thumbnail in the Column graph section of Prism to make a horizontal scatter plot without a mean line or error bar.
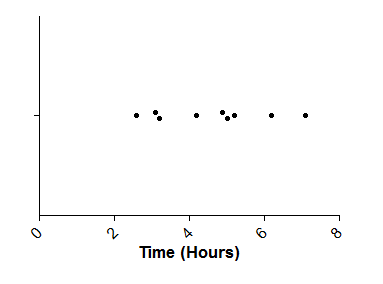
Enter the values you want to show on the time-line in a single column of the data table.

This will create a graph like this one:
Double-click on any data point to open the Format Graph dialog and change the graph style to an Aligned dot plot. You can also change the graph symbols. (You'll probably also have to change it again, to show no mean line or error bar.

To format the X axis, double-click on either axis to open the Format Axes dialog. For the X axis, choose how to space the ticks. Use the roll-down menu to choose how to display minor ticks on the axis. In the suffix box, enter a string of characters to follow each tick label. For example, enter ":00" and 1 becomes 1:00.

To move the symbols closer to the X axis, grab the end of the Y axis and drag it down.
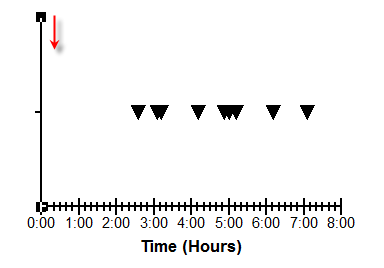
If you want to hide the Y axis entirely, double-click on the axis and go to the Frame and Origin tab of the Format Axes dialog. Choose to Hide Y Show X. Uncheck the box for a scale bar if you don't want one on your graph.

Right-click on any data point if you'd like to change the color or formatting individually. Use Prism's text tool to add any other labels.

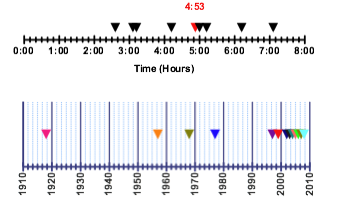
If you prefer, you can show the Y axis and add grid lines to make the graph easier to read. Double-click on an axis and go to the Frame and Origin tab of the Format Axes dialog.

You can format the major and minor tick gridlines differently

Another way to make a similar graph is to start with an XY data table. This will make it easier to have each data point formatted differently. Enter the value for the time-line in the X column, and enter a value for each, staggered so that each is in its own data set as below.

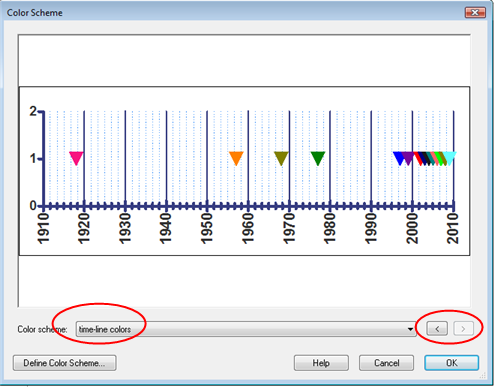
This will create a very similar graph that you can format in the same way as above. In addition, applying a color scheme will let you assign individual colors to each data set.
To keep the Y axis on this graph, but remove the number labels, double-click on the Y axis to open the Format Axes dialog and choose None in the label roll-down menu.


Download this file to see how these graphs were made.