
Graphing data expressed as fold changes, or ratios.
Many kinds of experimental results are expressed as a ratio of a response after some treatment compared to that response in control conditions. Plotting ratios can be tricky.
The problem is that ratios are inherently asymmetrical. A ratio of 0.5 is logically symmetrical with a ratio of 2.0. In fact, in some cases the decision about which value to place in the numerator (with the other in the denominator) it is pretty arbitrary. So the same results could be expressed as 0.5 or as 2.0 depending on the whim of the investigator. On a graph, 0.5 and 2.0 are not symmetrical. This is even more clear when you compare 0.1 and 10.0.
.png)
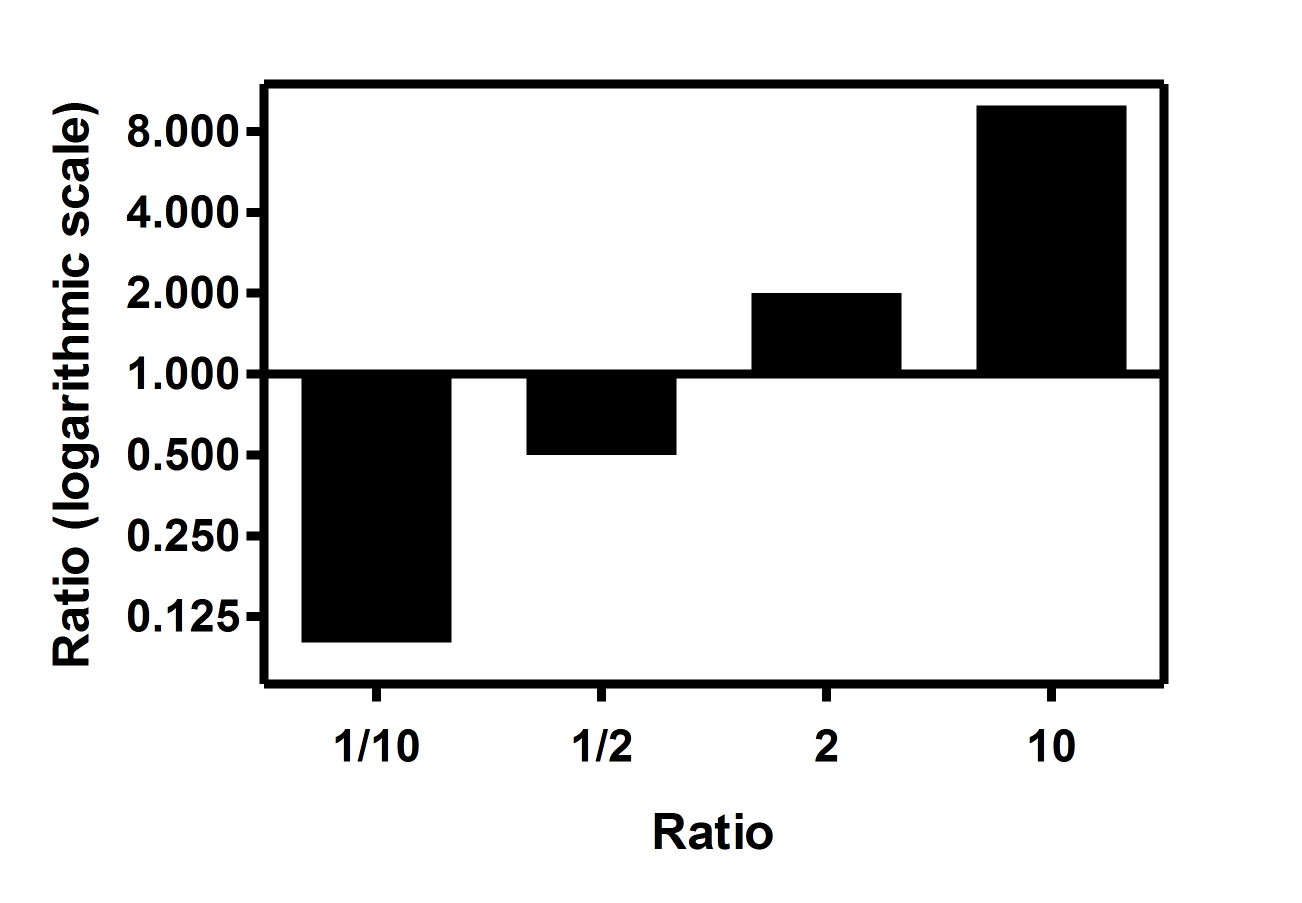
Prism note: I opened the Format Graph dialog by double clicking on the graph, then went to the third tab (Graph Settings) and set the baseline to be Y=1.0, rather than the default Y=0.0. That measn that bars with fractional ratios (decreases) point down, while bars with ratios greater than one (increases) point up.
The solution to this problem is logarithms. Convert that Y axis into a log base 2 axis, and everything makes more sense.
Prism note: To convert to a log base 2 axis, double click on the Y axis to bring up the Format Axis dialog, then choose a Log 2 scale in the upper right of that dialog.
This works because the logarithms of ratios are symmetrical. The logarithm of 0.5 is -0.301; the logarithm of 2.0 is 0.301. The logarithm of 0.1 is -1.0; the logarithm of 10 is 1.0. (These logarithms are all common logarithms, also known as base 10 logarithms, but the logs will be symmetrical no matter what base is used).
An alternative approach is to transform the values to their logarithms, and then plot those logarithms using antilog numbering. The advantage of this approach is that the logarithms might be useful in other analyses. You might want to compare two sets of log(ratios) with an unpaired t test. Or use a one-sample t test to test whether the mean of the log(ratios) is distinct from a hypothetical value (often 0.0, corresponding to a ratio of 1.0).
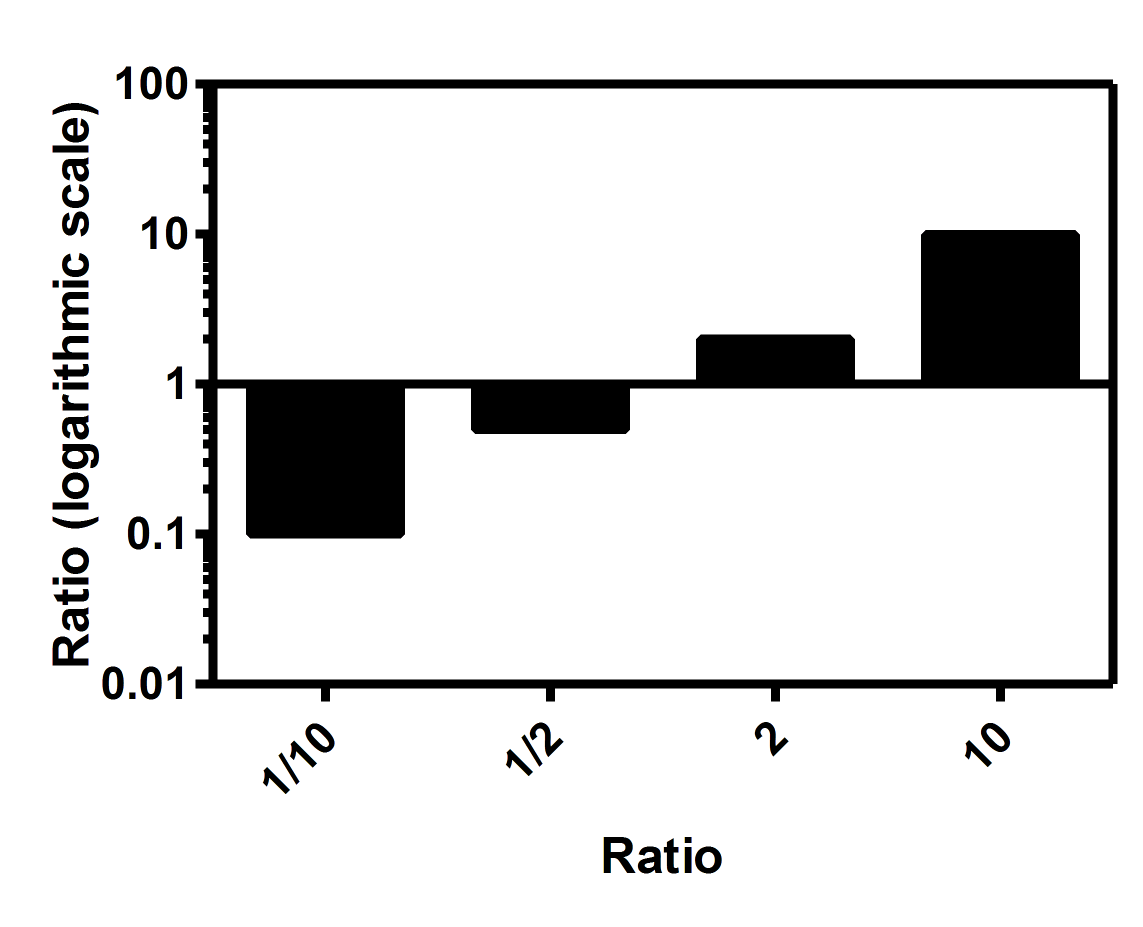
Prism note: The Transform analysis computed the log (base 10) of all the values, and these were plotted. On the Format Axis dialog, the numbering was set to antilogs (only available for base 10 logs) with minor logarithmic ticks.
Some people try to deal with this problem by converting a ratio of 0.5 to -2.0. The logic must be that since a decrease of 0.5 is equivalent to an increaes of 2.0, it should be expressed as -2.0. The problem with this approach is that the region between -1 and +1 is forbidden. So it is impossible to graph the data sensibly, and impossible to analyze.