




KNOWLEDGEBASE - ARTICLE #1727
How do I enter data for a basic column graph?
This example shows the basics of making a column graph or scatter plot.
How to do it:
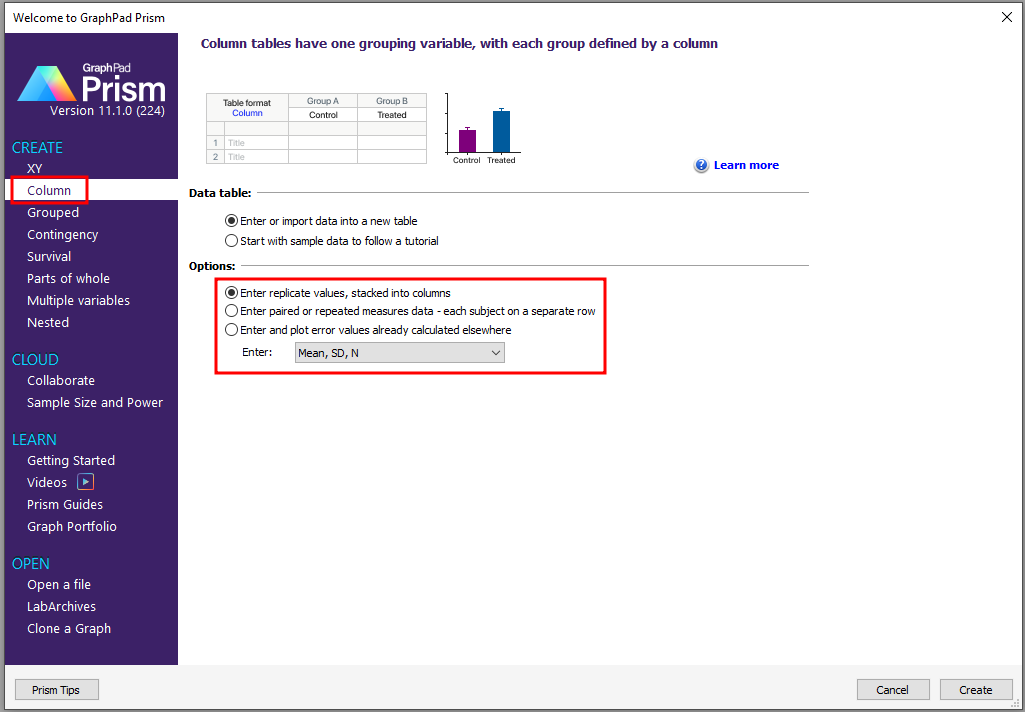
Start with the Column section of the Prism Welcome dialog. You can choose to enter your replicate data or to enter data where you have already calculated the error values elsewhere.
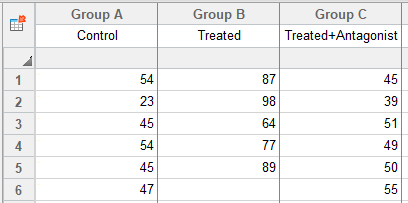
Enter all the replicate data for a data set in the same column.
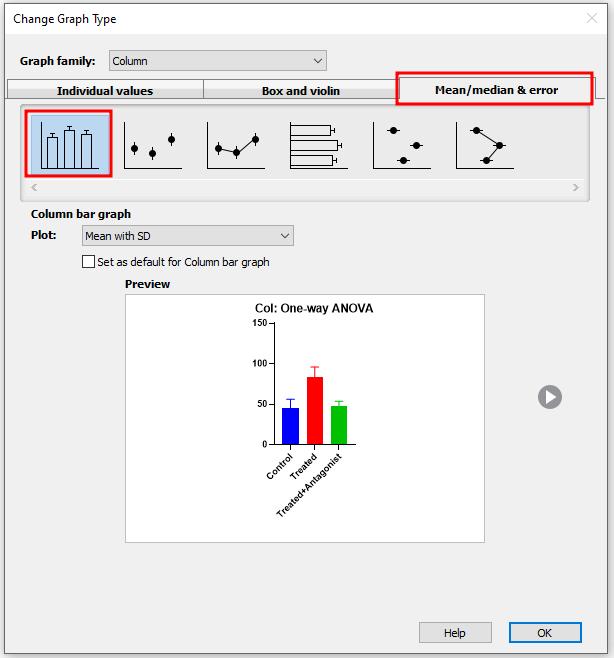
When prompted to create your graph, navigate to the 'mean/median & error' tab and select 'column bar graph.' The thumbnail preview shows you how your graph will look.
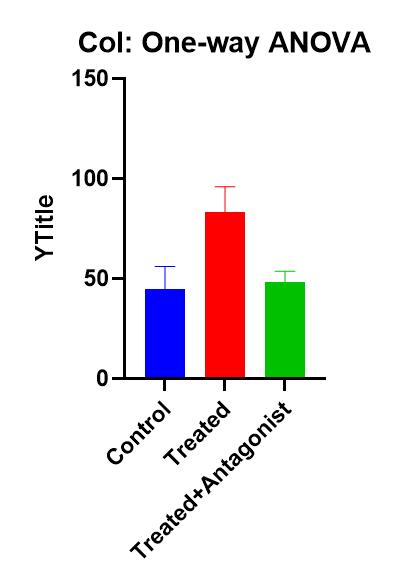
Your graph will be created:
If you later want to change the graph type, navigate to Change > Graph Type on the menu bar. For example, maybe you want to change your graph to a scatter plot with medians plotted.
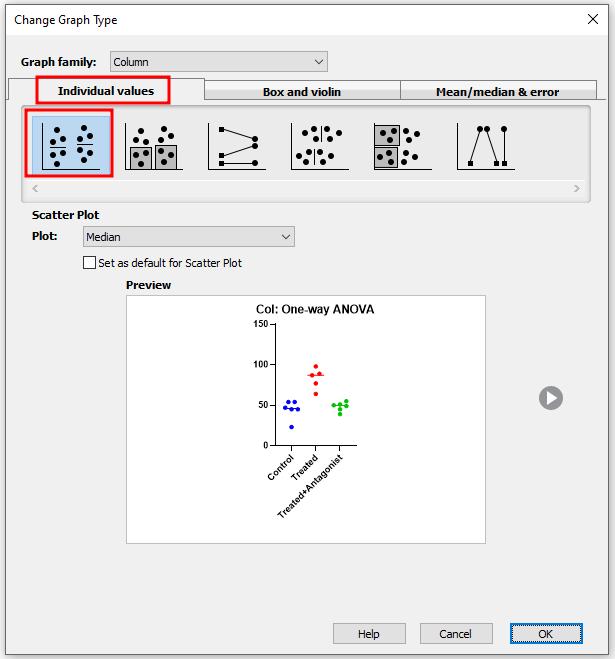
Your graph will look like the following:

Keywords: basic column graph