




KNOWLEDGEBASE - ARTICLE #1728
How do I enter data for a grouped bar chart?
This example shows the basics of making a grouped bar chart.
How to do it:
Start with the Grouped section of the Prism Welcome dialog. You can choose to enter single values, replicate data, or data where you have already calculated the error values elsewhere.
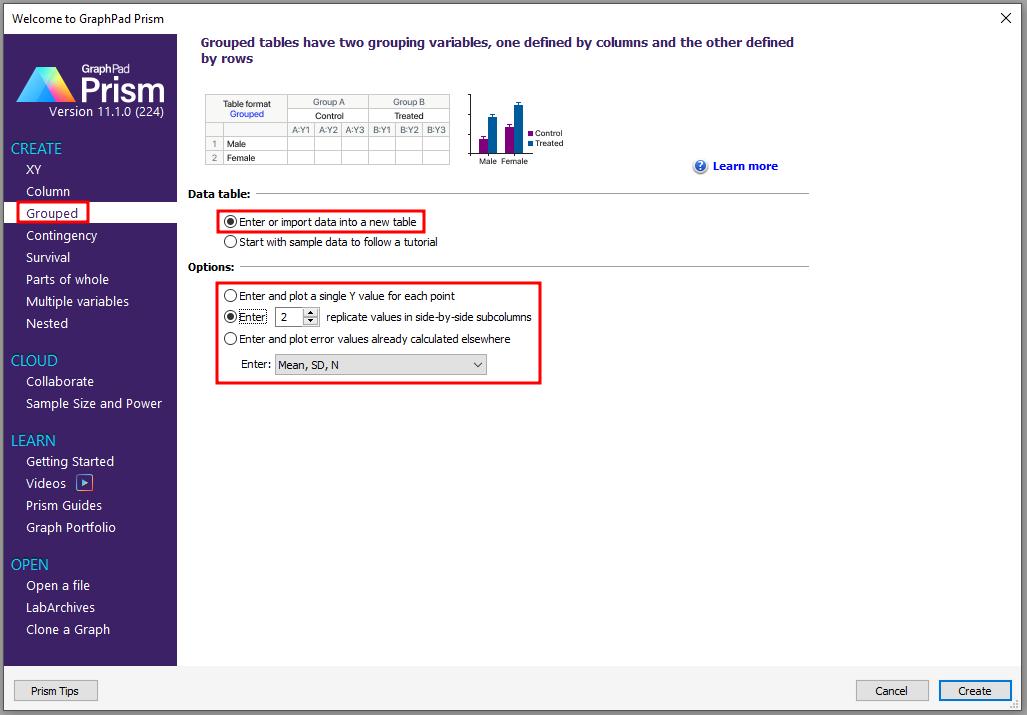
For this example, enter replicate data in side-by-side columns and the grouping factor in rows.
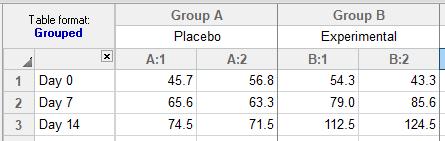
When prompted to create a graph, choose the thumbnail preview for how you want your graph to look.
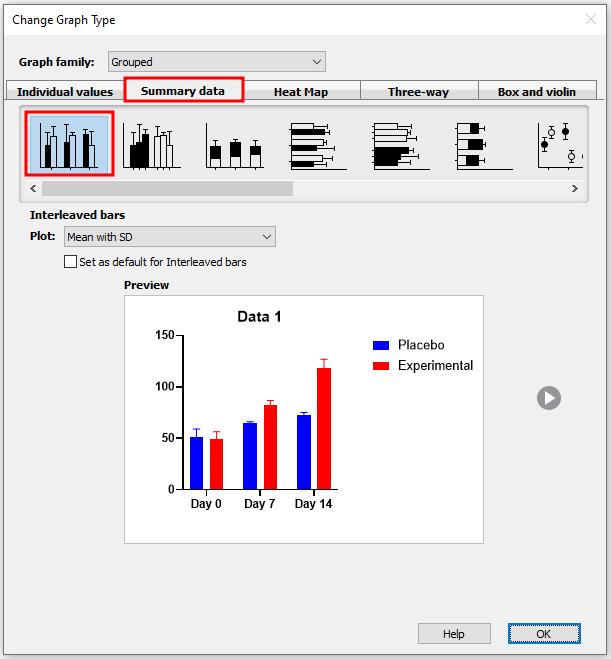
If you want to switch from interleaved bars to grouped, click the Change graph type button and select a new thumbnail preview.
Keywords: grouped bar chart