
KNOWLEDGEBASE - ARTICLE #1859
How to determine an IC50
Prism can easily fit a dose response curve to determine the IC50.
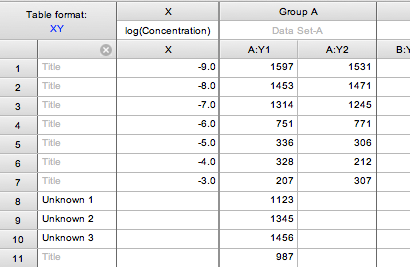
- From the Welcome dialog, choose the XY tab, drop the list of sample data sets and choose "RIA or ELISA".
- Note that the X values are logarithms of concentration. Prism offers built-in equations designed to handle X values as either concentration OR log(concentration). Be sure you select the correct equation when performing nonlinear regression! If you'd like to convert concentration values to log(concentration) values - or vice versa - you can use Prism's Transform analysis to convert the X values. Also note that this sample data set includes unknown values. These are Y values without corresponding X values. Prism can interpolate these X values.
- Click Analyze and then Nonlinear regression. Or click the Nonlinear Regression shortcut button just above the Analyze button.
- On the Nonlinear regression dialog, open the "Dose-Response -- Inhibition" family of equations, and choose "log(inhibitor) vs. response -- Variable slope (four parameters)". At the bottom of the dialog, check the option to "Interpolate unknowns from standard curve".
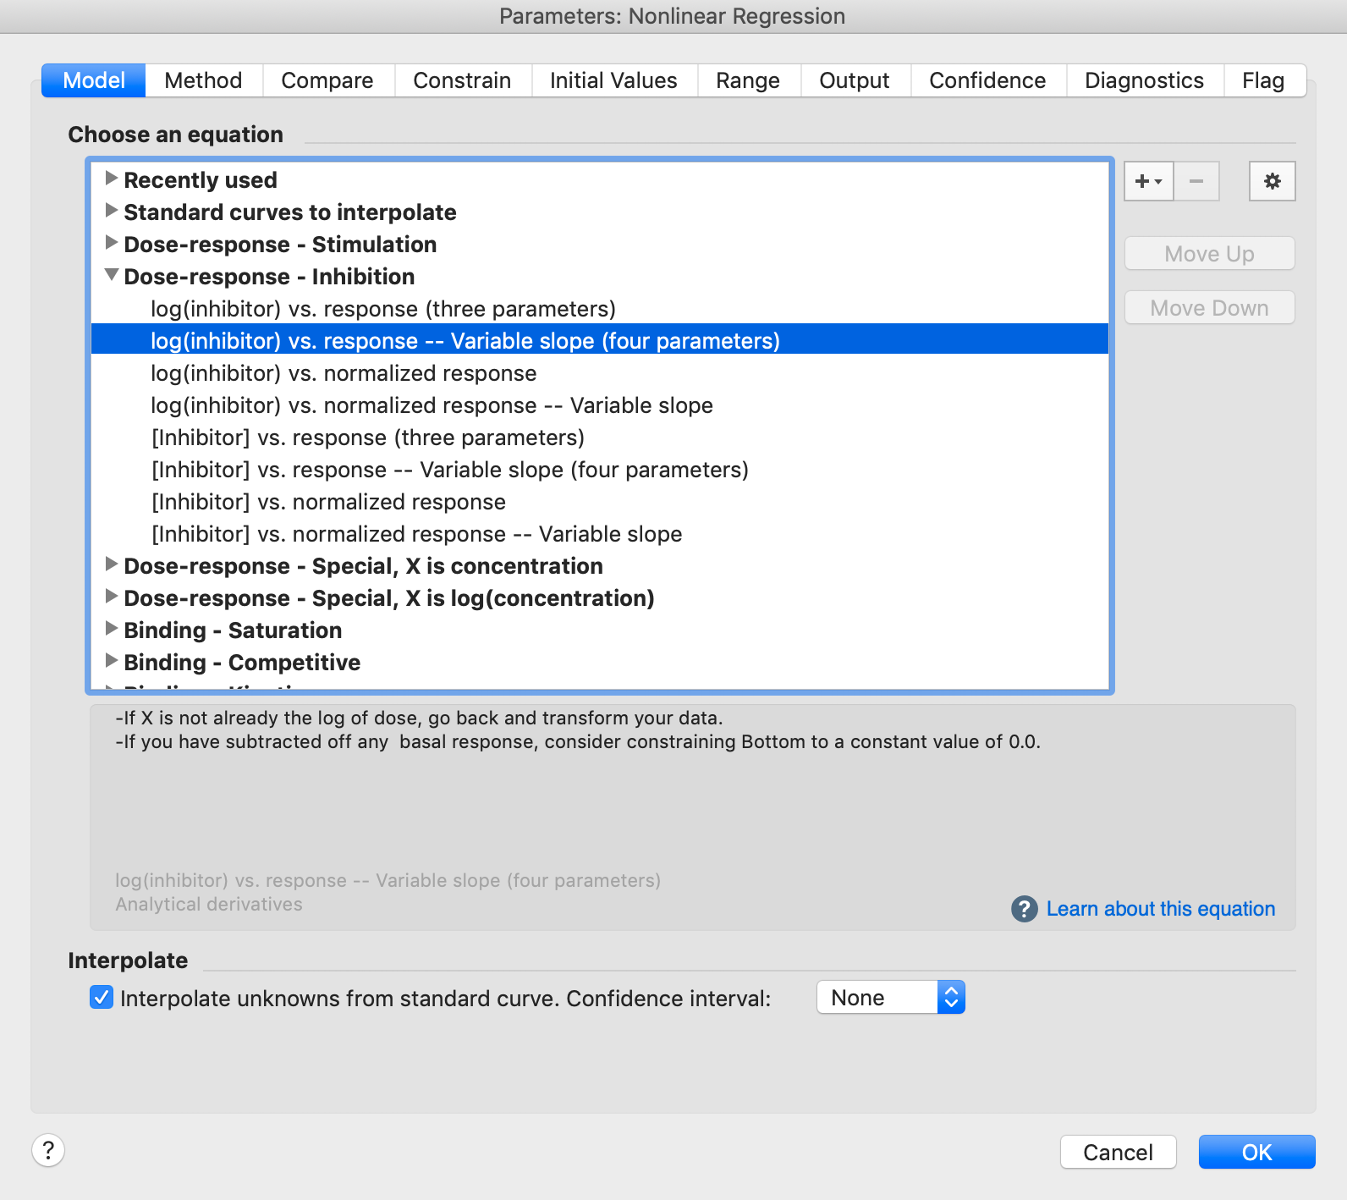
- Click OK and view the results.
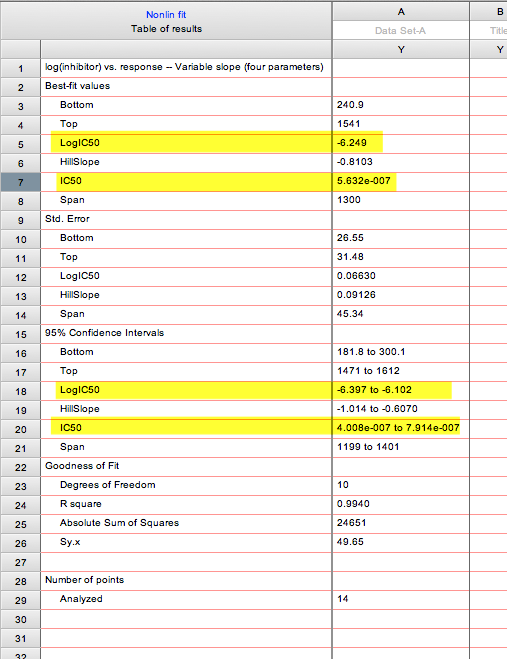
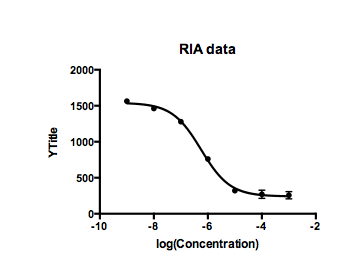
- View the graph.


More information:
- More tutorials on curve fitting
- Learn about the equation used to fit to the data.
- Interpreting nonlinear regression results
- How exactly is the IC50 defined?
- Relative vs. absolute IC50
- IC50 vs. EC50