
Plotting the geometric mean with geometric SD error bars
The figure below shows a plot of data sampled from a lognormal distribution. Notice that the distribution is not symmetrical.
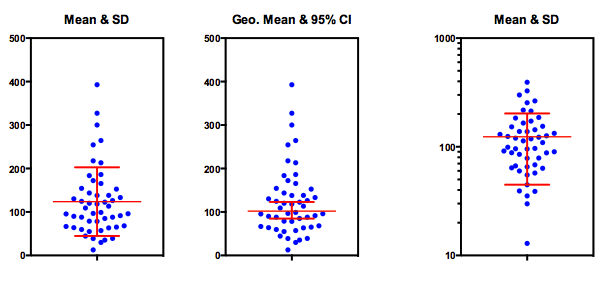
The graph on the left plots the individual data points and superimposes a horizontal line at the arithmetic mean, and error bars showing plus and minus one SD. This is a simple choice in Prism's Format Graph dialog. Showing the mean with SD error bars really does not do a great job of showing the variation in the data. If you only saw the mean and error bars (which many scientists like to plot) without the raw data, you would be mislead. If the data were more skewed, the SD might be large enough that the downward pointing error bar might go below the axis to a negative Y value.
The graph in the middle plots the geometric mean along with the 95% confidence interval of that geometric mean. These error bars give you a good sense of how precisely you know the population geometric mean, but don't show the amount of scatter.
The graph on the right uses a logarithmic axis. This is created in Prism by a setting in the upper right of the Format Axis dialog. The error bars show the arithmetic mean and the error bars show plus or minus one SD. The error bars are symmetrical in terms of the values they represent, but on a log scale the lower error bar is much longer. This still doesn't do a great job of showing variation. If the downward error bar would go to a negative value, Prism (starting with 6.05 and 6.0f) doesn't even show it at all (because negative values cannot be shown on logarithmic axes).
What about plotting the geometric mean with the geometric SD? Prism 7 can do this automatically, but earlier versions required some work as explained below.
To create the graphs below, I transformed all the values to their logarithms (base 10) using Prism's transform analysis.
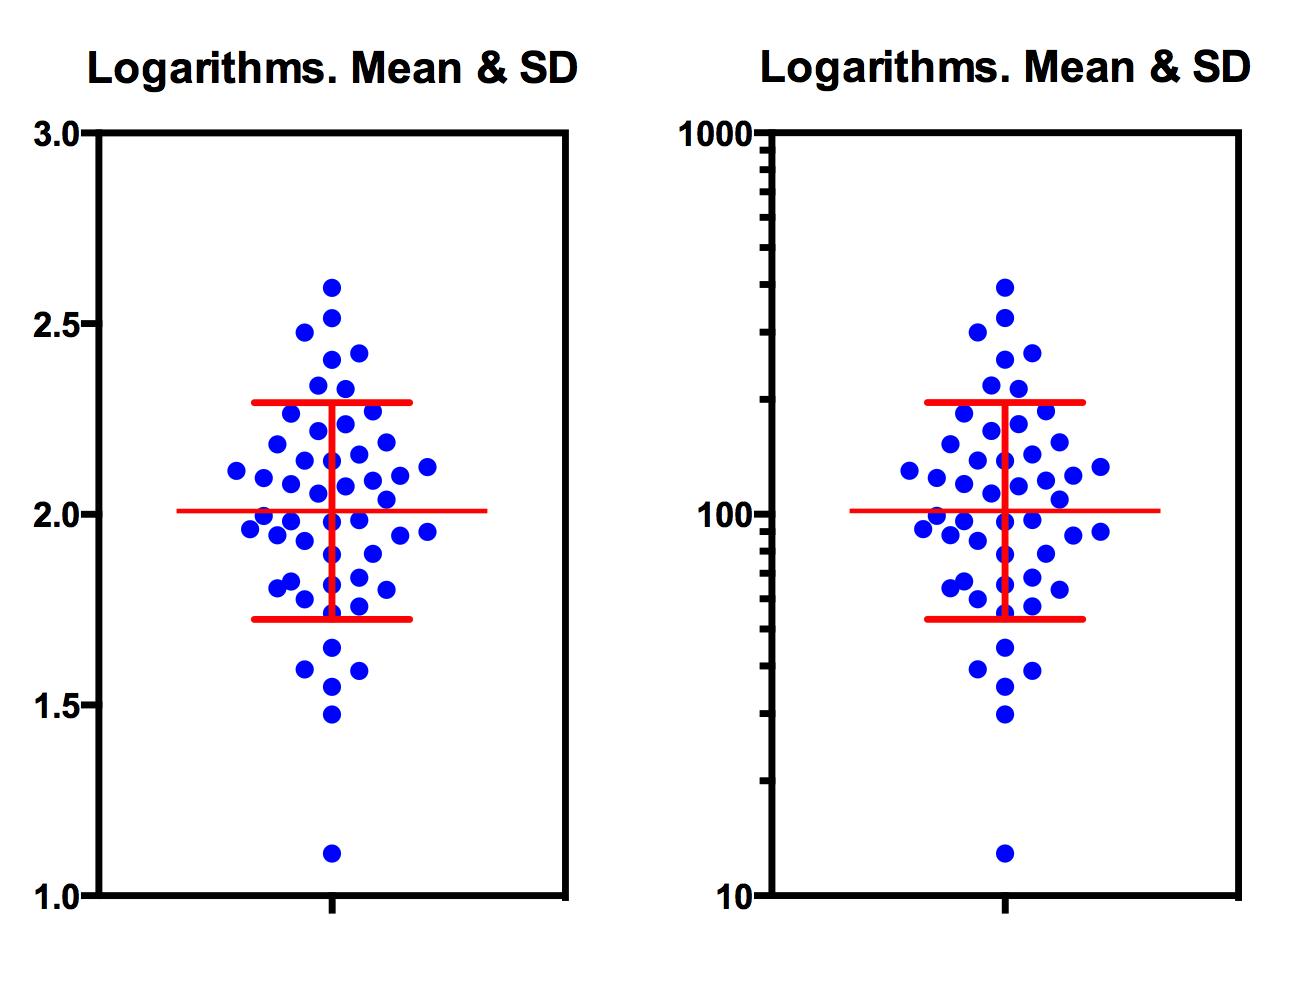
The Y axis of graph on the left shows the logarithms (the data that are actually plotted). The graph on the right plots antilogarithms instead, along with log spaced minor intervals. These settings are on the Format Axis dialog. The data are still logarithms. We just told Prism to label the Y axis with antilogarithms to make the graph easier to understand, and added log spaced minor ticks to emphasize the logarithmic nature of the axis.
The error bars in both cases show the mean of the logarithms plus or minus one SD of the logarithms. In other words, these error bars plot the geometric SD.
What is the geometric SD numerically? Run Prism's column statistics on the set of logarithms, and you can see that the SD equals 0.2845645. Take ten to this power to determine the geometric SD, which is 1.9256. Remember that logarithms essentially convert multiplication to addition. So while the SD of the raw data can be added to, or subtracted from, the arithmetic mean, the geometric SD must be multiplied times, or divided into, the geometric mean.
The geometric mean equals 102.074. Multiply this by 1.9256, and the top error bar extends up to 196.6. Divide the geometric mean by 1.9256, and the bottom error bar extends down to 53.0. You can see that these values match what is plotted in the figures above. The geometric SD error bars appear symmetrical in terms of length of the axis, but since the axis is logarithmic, they are not symmetrical numerically (on the scale of the data). This makes sense as the lognormal distribution is asymmetrical.
When you compute the SD of a set of values, the SD is expressed in the same units as the data, which is also the same units as the mean, the median and the geometric mean. In contrast the geometric SD is not expressed in these units. In fact, it has no units -- it is a unitless ratio. It makes no sense to ever add the geometric SD to the geometric mean (or any other value), and makes equally no sense to ever subtract the geometric SD from the geometric mean. The geometric SD is a value you always multiply or divide by.
The term geometric SD is not commonly used. It was introduced by Kirkwood (1).
Reference
1. Kirkwood, TBL (1979). "Geometric means and measures of dispersion". Biometrics 35: 908–9.
(Rewritten Sept 26, 2014)
Prism file The use and abuse of logarithmic axes.