
Prism 3 -- Calculating "Unknown" Concentrations using a Standard Curve
Step-by-Step Examples:
Calculating "Unknown" Concentrations using a Standard Curve in Prism 3
A standard curve is a graph relating a measured quantity (radioactivity, fluorescence, or optical density, for example) to concentration of the substance of interest in "known" samples. You prepare and assay "known" samples containing the substance in amounts chosen to span the range of concentrations that you expect to find in the "unknown" samples. You then draw the standard curve by plotting assayed quantity (on the Y axis) vs. concentration (on the X axis). Such a curve can be used to determine concentrations of the substance in "unknown" samples. Prism automates this process.
Prism can fit standard curves using nonlinear regression (curve fitting), linear regression, or a cubic spline (or LOWESS) curve. To find "unknown" concentrations using a standard curve, follow these steps:
Enter the Data
In the Welcome to Prism dialog box, select Create a new project and Work independently. Choose to format the X column as Numbers and to format the Y column for the number of replicates in your data. For our example, choose A single column of values.
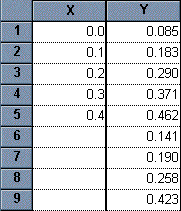
Enter data for the standard curve. In our example, shown below, we entered concentrations for the "known" samples into the X column, rows 1-5, and the corresponding assay results into the Y column. Don't worry if Prism displays trailing zeros that you didn't enter--we'll change that later. Just below the standard curve values, starting in row 6, enter the assay results for the "unknown" samples into the Y column, leaving the corresponding X cells blank. Later, Prism will fit the standard curve and then report the unknown substance concentrations using that curve.
 |
Fit the Curve
Click on the Analyze button. Choose Built-in analysis. From the Curves & Regression category, select Linear regression if you are using our example data (or if you are analyzing data that you suspect are curvilinear, choose Nonlinear regression [curve fit]). For an example of how to proceed with nonlinear data, see the example on Analyzing RIA or ELISA Data.
In the Parameters: Linear regression dialog box, check the box labeled Standard Curve X from Y, because we want our unknown concentrations to be provided. In the Output options category, select the Auto options for determining where Prism will start and end the regression line. Set the number of significant digits to 3.
When you click OK to leave the linear regression parameters dialog, Prism performs the fit and creates a results sheet.
View the Results
Prism displays the results on pages called views. The default view shows the defining parameters for the curve of best fit.
Locate the drop-down box labeled "View" in the third row of the tool bar (not the "View" menu at the very top of the screen). Select Interpolated X values (in early Prism releases, this was "Standard curve X from Y").
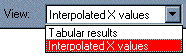 |
Prism reports the corresponding X value for each unpaired Y value on your data sheet.
Add Unknowns to your Graph
Prism's automatic graph includes the data from the data sheet and the curve. To add the "unknowns" to the graph:
Switch to the Graphs section of your project.
Click on the Change button and then select Data on Graph.
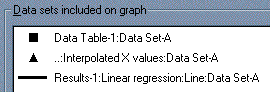
The dialog box shows all data and results tables that are represented on the graph. Click on the Add button.
From the drop-down list at the top of the Add Data Sets to Graph dialog box, select ...Linear regression: Interpolated X values.... Click on Add, then Close. The list of data sets included on the graph should now look like the window below.
 |
Press OK to return to the graph.
If you want the "unknowns" represented as spikes projected to the X axis (rather than data points), click on the Change button and select Symbols and Lines. From the "Data set" drop-down list, select ...Linear regression: Interpolated X values.... Change the symbol shape to one of the last 4 options (spikes), and set the size to 0.
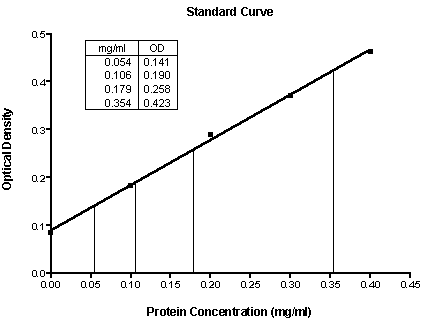 |
Standard curve results -- Unknowns are represented as spikes on the graph; numerical results are reported as an embedded table. The illustration includes some formatting changes not discussed here.