
Prism tip - Creating a multiple baseline design chart

This example shows how to make a multiple baseline design plot. This is accomplished by customizing the appearance of one graph, cloning this graph appearance to two new graphs, then creating a layout containing all three graphs together in a single sheet.
How to do it:
Start by creating an XY data table to enter the data. For this example, we won't have any replicates or error estimates, so when we create our XY data table, we'll choose "Enter and plot a single Y value for each point" for the "Y" options.

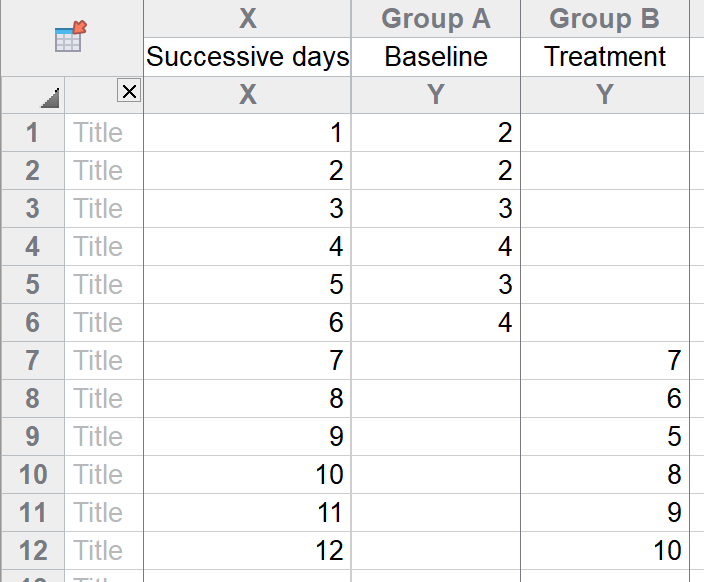
After clicking Create, the newly-created XY table will be shown and the data can be entered (as shown below). Note that we're going to use two separate columns to enter the data: one column for our "Baseline" values and one for our "Treatment" values. Entering the data this way will allow Prism to automatically connect the two sets of points together on the graph with connecting lines.
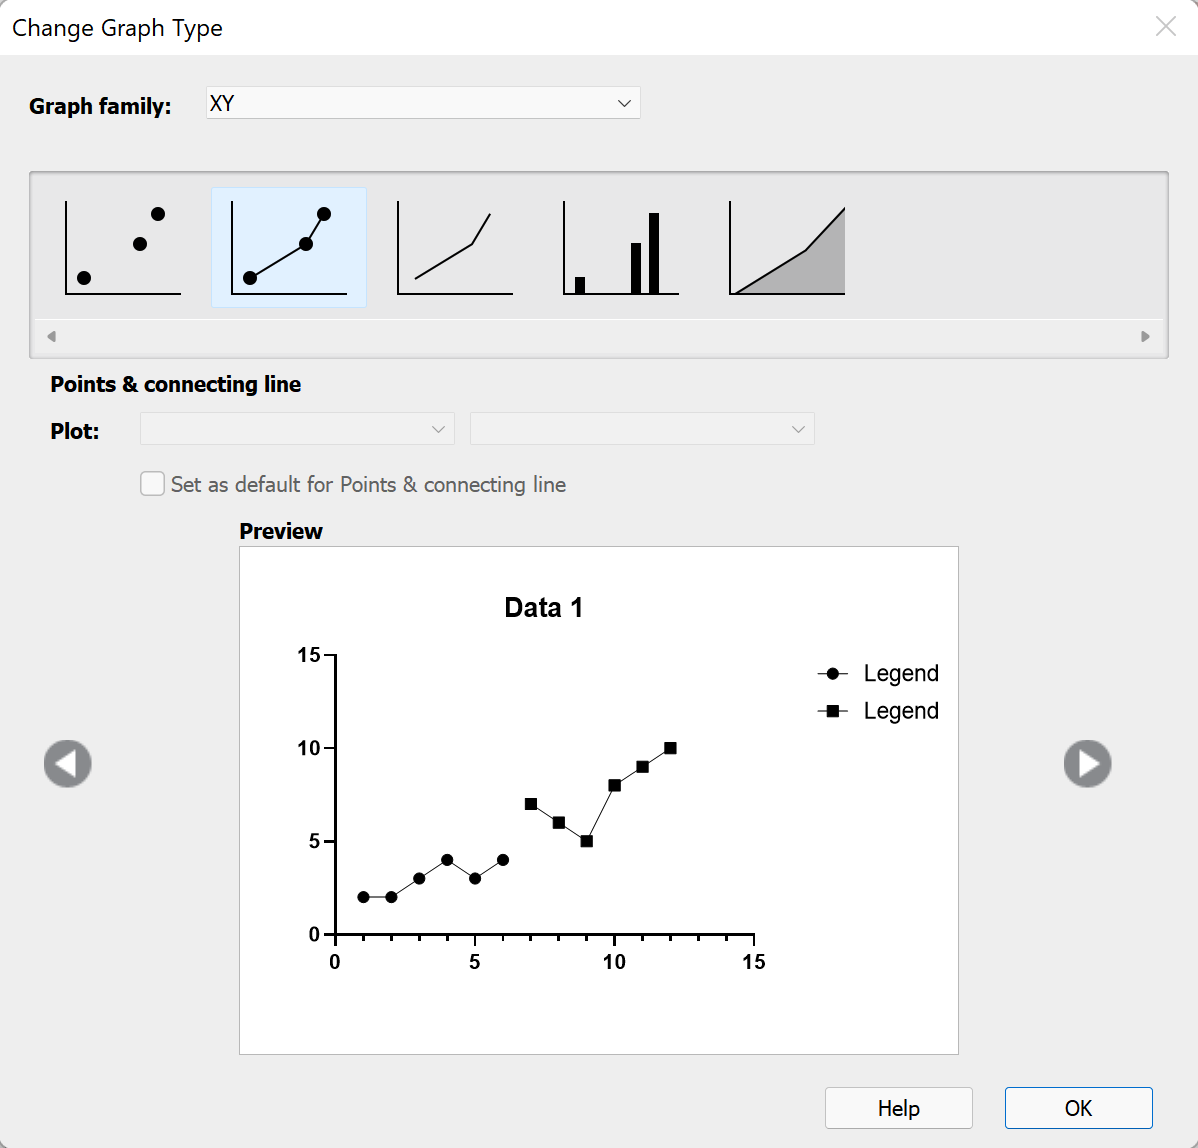
Once the data for this first graph have been entered, click on the corresponding graph sheet in the Navigator. Since this is the first time you've viewed the graph, the Change Graph Type dialog will appear so that you can specify the type of graph you'd like to create. For this example, we'll choose the "Points & connecting line" graph type in the XY graph family.
The first thing we'll want to do to customize this graph is to add a vertical separating line between our "Baseline" data and our "Treatment" data. To add a vertical line to this XY graph, double click on the X axis to bring up the "Format Axes" dialog (alternatively, you can click the "Format Axes" toolbar button). At the bottom of the "X axis" tab, the "Additional ticks and grid lines" options can be used to add custom ticks or vertical lines to the graph. For this graph, we'll want to add our vertical line at a value of 6.5 on the X axis, so we enter this value in the "At X=" text box. We can then check the box for "Line", and click the "Details" ("...") button for more customization options.

Upon clicking the "Details" button, the "Format Additional ticks and Grids" dialog will appear. Using this dialog, we can change the appearance (thickness, style, color, etc.) of the vertical line we're adding to the graph. For this example, we'll use the "Thickness" dropdown menu to change the line weight to 1/2 pt, and we'll use the "Style" dropdown menu to change the line to a solid line.

Click "OK" on the "Format Additional Ticks and Grids" dialog, but don't click "OK" on the "Format Axes" dialog yet. Instead, select the "Titles & Fonts" tab at the top of this dialog. We're going to use these controls to change the position of the Y axis title to be centered above the Y axis. To do this, find the "Axes titles" section of the dialog, and then find the "Location" dropdown menu for the Left Y axis Title. In this dropdown menu, select "Above, Centered". Now, when you click on "OK" on the "Format Axes" dialog, you should see that the line has now been added to our graph, and the default "YTitle" axis title has been moved to the top of the Y axis.

To finish customizing this graph, we're going to do the following:
- Click on the default "YTitle" axis title text and type "Subject one"
- Click on the graph title and delete it (we don't need it)
- Make sure that all of the text (axis labels, axis titles, legends, etc.) are un-bolded
- Move the legend into the graphing area to save space
With these steps done, the graph should look something like this:

Now we're ready to create the graphs for our other two subjects (or settings, behaviors, etc.). To do this, we could manually follow all of these steps again to create another custom graph. However, to save time, we can use this existing customized graph as a starting point, and simply clone it using new data. To do this, click in the Navigator where it says "New Data Table...".

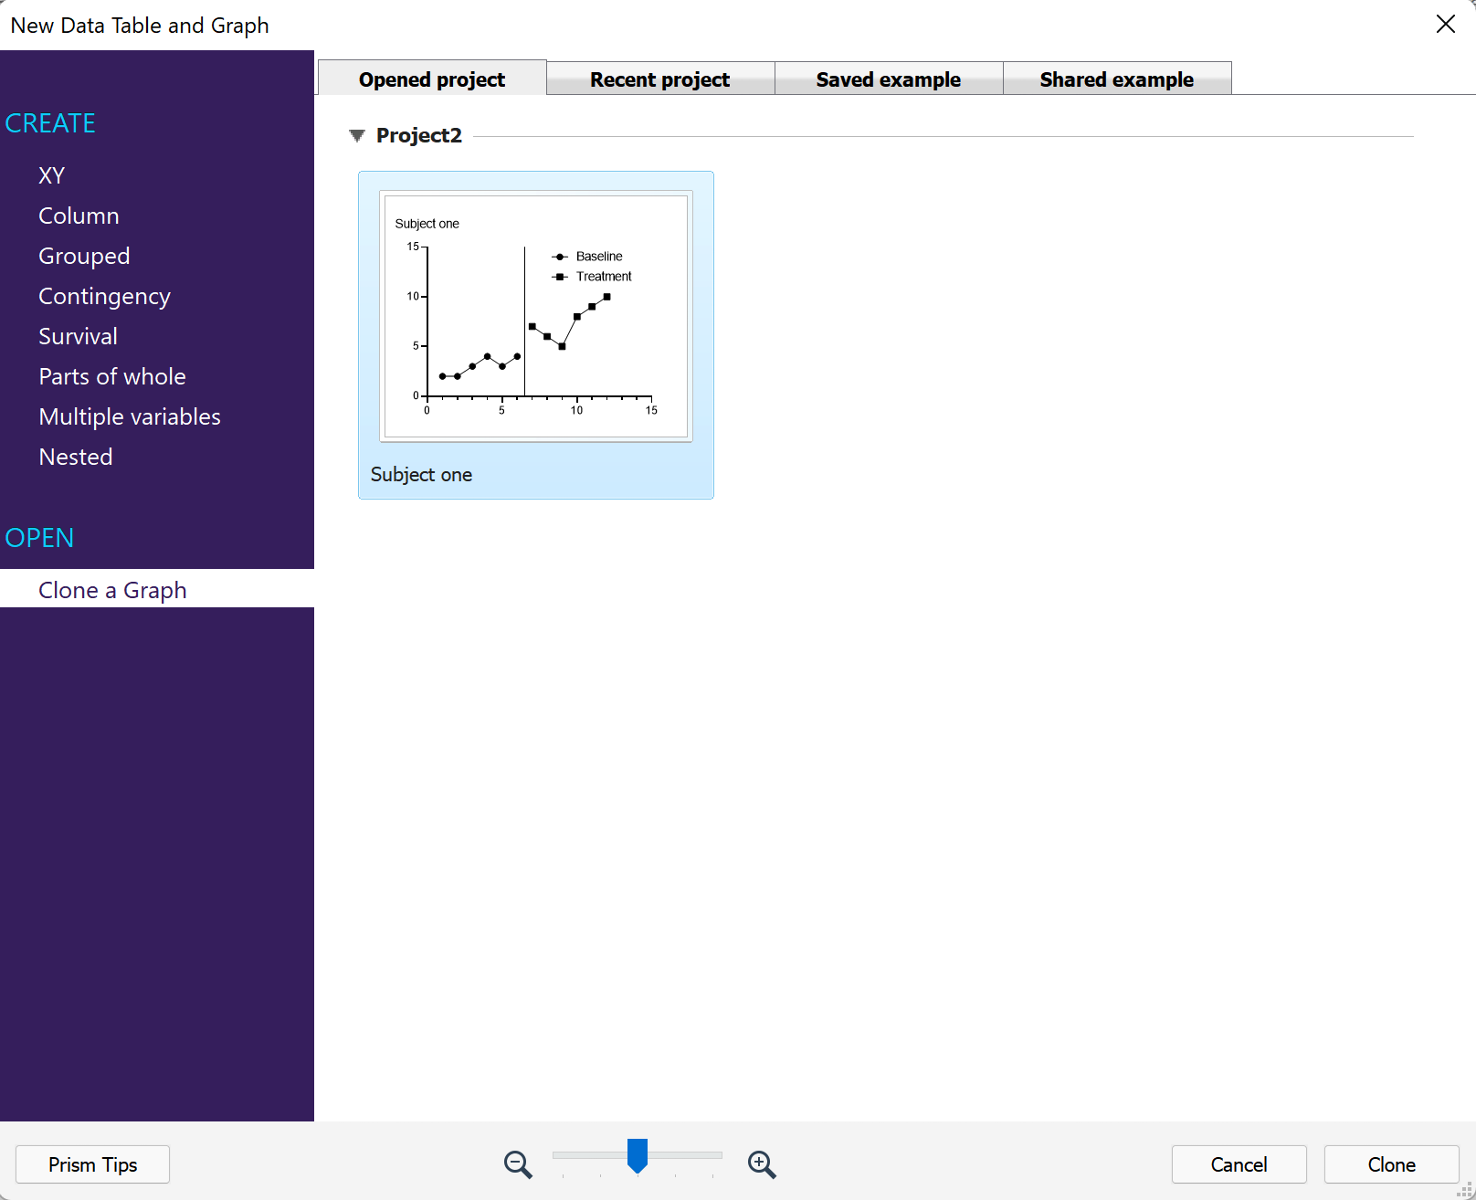
This will bring up the "New Data Table and Graph" dialog. On the left side of this dialog, at the bottom, select "Clone a Graph". Find the graph that you just customized on the first tab ("Opened project"), and click the "Clone" button at the bottom right of the dialog.
Now, the "Clone Example" dialog should be shown. On this dialog, you can choose to keep (or delete) the Y values, the X values, the column titles, or the row titles from the original graph. For this example, we'll choose to delete the Y values and click "OK".

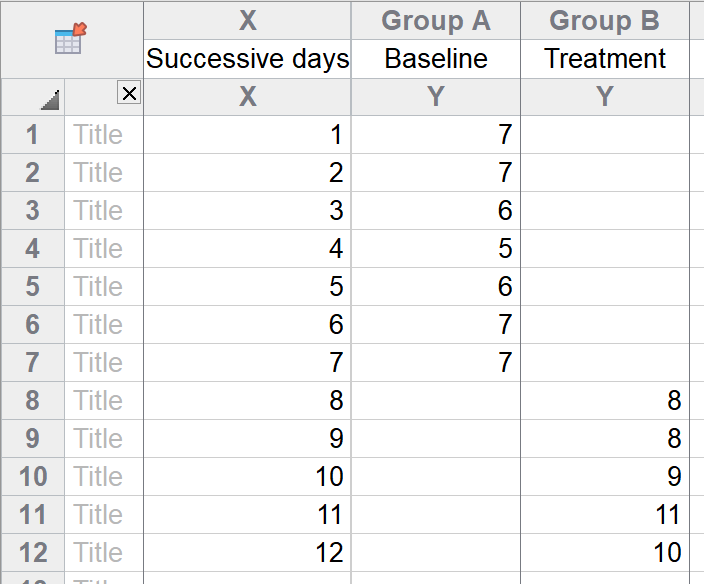
This creates a new data table (and graph) that has the same X values, column titles, and graph customization settings, but no Y values. For this example, we can now enter the data for the second graph as shown below.
If we switch to the graph, we'll see that all of the customization settings that we defined on the first graph have already been applied to this new graph. Because our baseline and treatment values have different X values, we'll want to change the position of the vertical line on this new graph, but that's easy to do. Simply double-click on the X axis to bring up the "Format Axes" dialog, and change the X value of the vertical line in the "Additional ticks and grids lines" section on the "X axis" tab of options.
%20-%20Multiple%20Baseline%20Design.png)
After clicking "OK", we can also change the Y axis title to read "Subject two", and delete the legends from this graph (we'll only need one legend when we create our combined figure). Now, your second graph should look like this:

Use the same procedure of cloning this graph to create the third graph. The data for this third graph is as follows (note that this third graph contains two more rows of data than the first two; don't forget to add the X values as well as the Y values after cloning!).

Follow the same steps as before to change the location of the vertical line on this third graph, change the Y axis title to read "Subject three", and delete the graph legends (if needed). At this point, your third graph should look like this:

At this point, we're nearly ready to combine our three graphs into a single figure using a Layout. However, before we do this, we'll want to make one last change to the first two graphs that we made. Click on the graph for "Subject one", select the X axis title text and delete it, then do the same for the graph of "Subject two". All three graphs will have the same X axis title text in the combined figure, and we'll only need to keep this on a single graph (the graph of "Subject three").


With that done, we're ready to generate the layout. In the Navigator, click in the "Layouts" section where it says "New Layout...".
%20-%20Multiple%20Baseline%20Design.png)
This will bring up the "Create New Layout" dialog, which allows you to customize the layout and orientation of the new Layout. For this example, we'll use a standard 1x3 arrangement (three graphs arranged vertically), and we'll select the option to "Fill the layout with graphs, starting with", making sure that the graph of Subject one is selected.

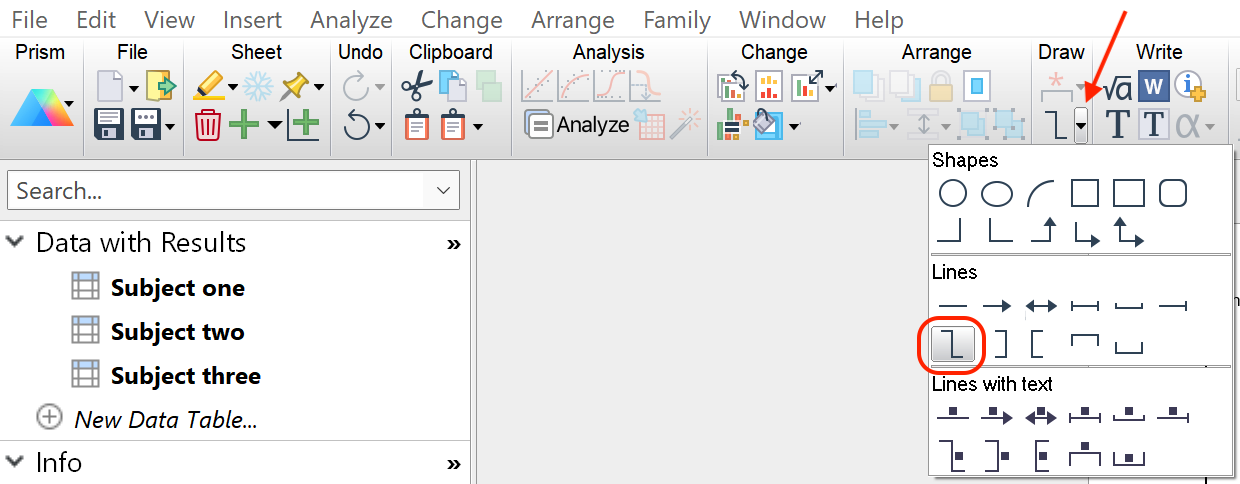
After clicking "OK", Prism will automatically add all three graphs to the same graph sheet. Now, the only remaining task is to add the connecting lines between each of the graphs of the figure. To do this, click the "Select a drawing tool" dropdown button in the Change section of the toolbar, and choose the "zig-zag line" tool. Then, simply click and drag on the layout sheet to add a connecting line from the bottom of one vertical line to the top of the next. Note that you can zoom in on the layout and move the ends of the drawn zig-zag lines to ensure that they align well with the vertical lines of the graphs.
Finally, you can double-click on the drawn zig-zag lines to open the "Format Object" dialog. Here, you can change the thickness (for this example, the zig-zag lines were set to 1/2 pt) and the style (this example uses a dashed zig-zag line).

With all of these steps complete, the final product should look something like the following:
And you're done!
Download this file to see how this graph was made.