
Standard deviation of the residuals: Sy.x, RMSE, RSDR
After fitting data with linear or nonlinear regression, you want to know how well the model fits the data. One way to quantify this is with R2. Another way is to quantify the standard deviation of the residuals. The residual is the vertical distance (in Y units) of the point from the fit line or curve. If you have n data points, after the regression, you have n residuals.
If you simply take the standard deviation of those n values, the value is called the root mean square error, RMSE. The mean of the residuals is always zero, so to compute the SD, add up the sum of the squared residuals, divide by n-1, and take the square root:

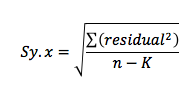
Prism does not report that value (but some programs do). Instead it reports the Sy.x. It is computed in a very similar way, but the denominator is n-K, where K is the number of parameters fit by regression. The value n-K is the number of degrees of freedom of the regression. If you only fit one parameter, then the RMSE and Sy.x are the same. If you fit two or more parameters, the Sy.x is larger and is a better estimate of goodness-of-fit.
If you chose robust regression, Prism computes a different value we call the Robust Standard Deviation of the Residuals (RSDR). The goal here is to compute a robust standard deviation, without being influenced by outliers. In a Gaussian distribution, 68.27% of values lie within one standard deviation of the mean. We therefore calculate this value, which we call P68. It turns out that this value underestimates the SD a bit, so the RSDR is computed by multiplying the P68 by n/(n-K), where K is the number of parameters fit.
All three values (RMSE, Sy.x, and RSDR) are expressed in the same units as Y and all can be interpreted in roughly the same way as the typical deviation of the points from the line or curve.