




Performing a t Test from a Prism Column data table
A t test, typically done to compare observations made in two groups subjected to different experimental treatments, is probably the most common statistical analysis. As with other statistical tests, your experimental design and data should fulfill certain criteria, and the results should be interpreted carefully. Prism provides help in both cases.
To use Prism to perform a t test, follow these steps:
Enter the data
In the Welcome to Prism dialog box, choose Column data table in the navigator. When doing a t test, Prism analyzes any two Y columns that you designate. Leave the default settings and click Create to exit the "Welcome dialog". Prism next displays an empty data table.
Enter the data into the table. We want to compare experimental observations made on two sample groups treated in different ways. The data for one treatment group will be entered under the heading "A", and the data for the other treatment group will go under the heading "B". For our example, we've labeled the groups "Control" and "Treated".
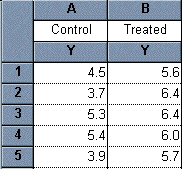
Many statistics programs expect you to enter data in an indexed format, as shown here:
| Group |
Value
|
| 1 | 4.5 |
| 1 | 3.7 |
| 1 | 5.3 |
| 1 | 5.4 |
| 1 | 3.9 |
| 2 | 5.6 |
| 2 | 6.4 |
| 2 | 6.4 |
| 2 | 6.0 |
| 2 |
5.7
|
One column contains all the data, and the other column designates the group. Prism can analyze data entered in a tidy format. However, you need to enter this data into a Multiple Variables data table and perform the t-test from the Multiple Variables list of analyses.
Choose an analysis
Back to the data in the Column data table format, click on the Analyze button, then choose the Column analysis t tests (and nonparametric test). Leave both data columns selected; however, when your table has more than two columns of data, you must have exactly two columns selected for Prism to analyze.
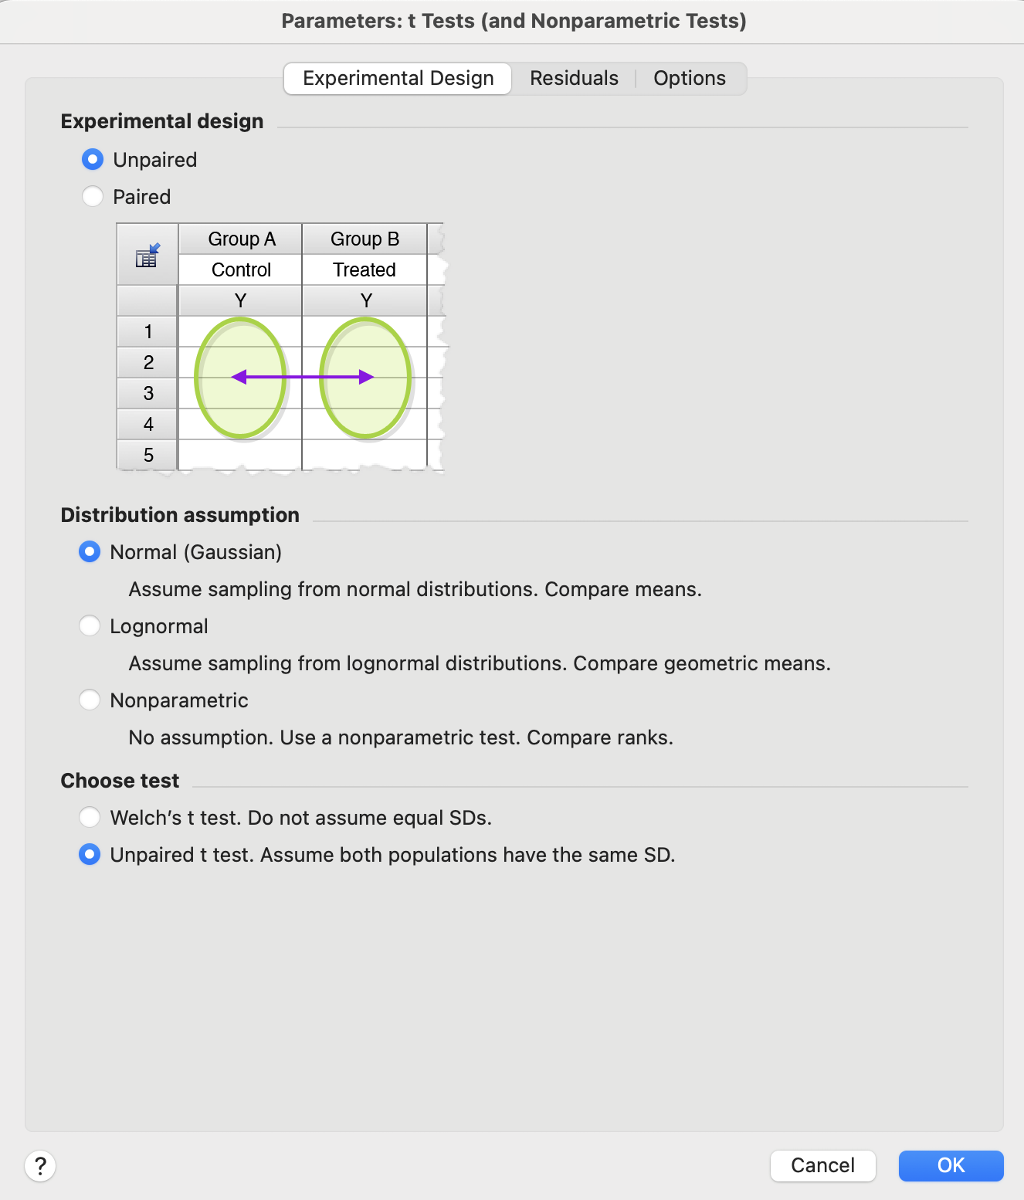
In the t test and nonparametric tests dialog box, choose a test as follows:
- Decide whether the data is "paired". Select a Paired test when each row (therefore, each pair) corresponds to a particular subject or condition. When this is the case, it's usually fairly obvious. For example, you've made one observation under "control" conditions (before treatment) and the "paired" observation during or after treatment in the same individual. In our example experiment, the data are not paired.
- Decide whether you are willing to assume that your data follows a Gaussian (i.e., normal) distribution. If not, check Lognormal or Nonparametric. While some applications make the choice for you, Prism does not, because it is usually impossible to tell whether the population is Gaussian just by analyzing the distribution of a small sample. You must make that decision based on your knowledge of previous data and/or the expected type of variability in your experiment. A t-test is parametric.
- If you choose Normal or Lognormal, then Welch's correction becomes an option. This option does not assume equal standard deviations.
- On the Options tab, you can choose a one-tailed or a two-tailed test. Usually, a two-tailed test is the correct choice. Also on this tab, if you want to see descriptive statistics for each of the data sets, check the box Descriptive statistics for each data set.
Make the following choices:
When you click OK to exit the dialog, Prism automatically switches to the Results section of your project and displays the analysis results.
Inspect the results
The P value is 0.0055. That is, there is less than a 1% chance of measuring a difference as large, or larger, than you saw simply as a consequence of random sampling. Since P is far lower than the traditional cutoff of 0.05, the difference is termed "statistically significant".
The difference between sample means is 1.46. The 95% confidence interval for the difference between population means is 0.57 to 2.35. This means we can be 95% sure that the difference in population means (essentially the difference we would see if we repeated the experiment many times) lies within that range.
Keywords: t test t-test ttest