




Using Prism Templates
If you use Prism to perform the same task many times, with only the data differing from time to time, you can save a lot of time and effort by using templates. A template is a Prism project file that holds the "framework" for your project. The first time you set up the project, you create the template--formatted data tables, analyses, formatted graphs, layouts--but you store it without the data. From then on, just open the template, add new data, and you're done.
Prism has some other automating and customizing tools that are sometimes confused with templates, methods and user-defined equations. We'll touch on the differences near the end of this example.
In this example, we'll make a template to produce a graph showing a linear fitted curve.
Create the Project
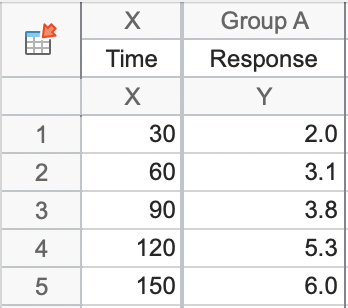
Create a new project formatted for numbers in the X column and a single column of Y values. Enter the column headings and the data shown below. The actual values are not especially important, since they will change each time you use the template, but you need some data to create a graph and to make changes for our example.
Click Analyze. In the Analyze Data dialog, select XY analyses and then choose Simple Linear Regression and click OK.
Now we'll format the graph. Click on the graph corresponding to this data table in the Prism navigator and click OK to select the default graph. Double-click the x-axis and set it to the options shown below.
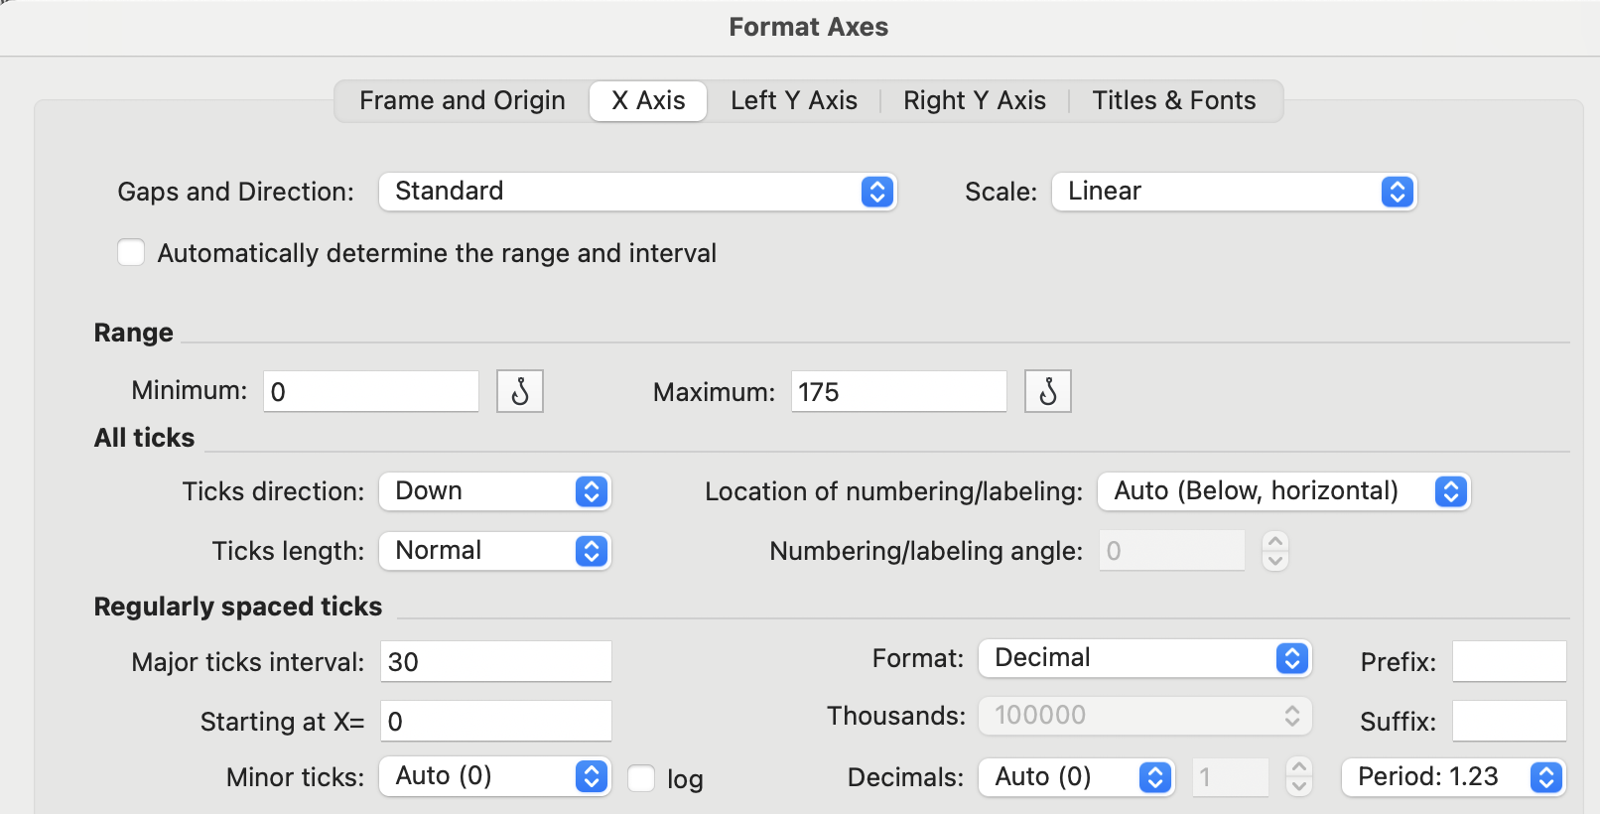
Click OK to return to the graph. Double-click on a symbol. Change the size to 5 and the color to red. Here are the selections:

Edit the axis titles, and delete the graph title, so that your graph will look like this:

Now we'll add to the graph some information about the regression line to the graph. Choose Insert Info or Analysis Constant from the Insert menu. Navigate to the regression equation and double-click it to add it to the graph.
Create and Save the Template
Now that you have created the graph that you'll use as a template, go to the Data Table and delete the data.
If you generally have the same X values when you use a particular template, you can leave those values in place.
Place the cursor in the data table. Select File > Save Template (Windows) or File > Save Special > Save Template (Mac). Fill out the dialog box as shown below.
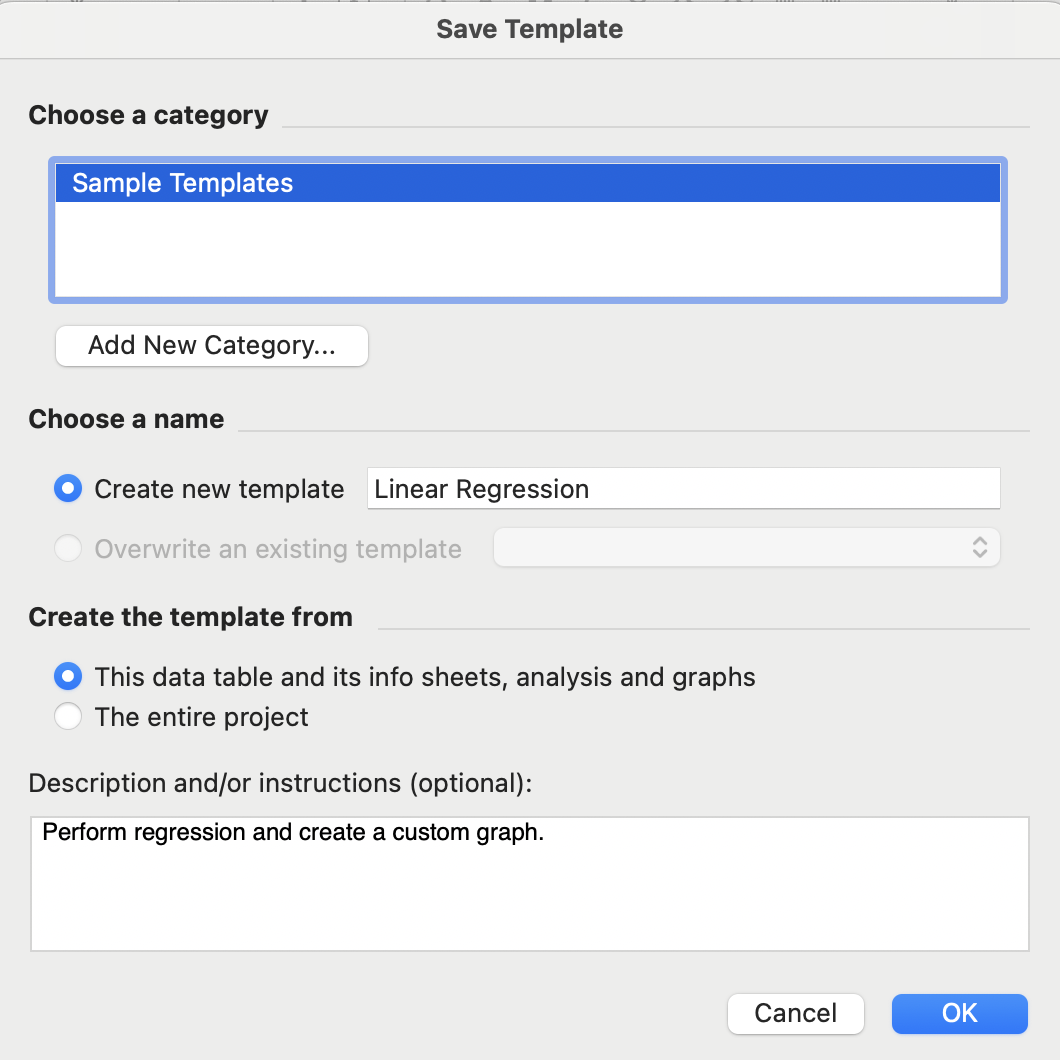
Now close the file, and we'll see how to use the template.
Use the Template
Launch Prism and choose Open a File on the left side panel. You should see a section Sample Templates as shown below:
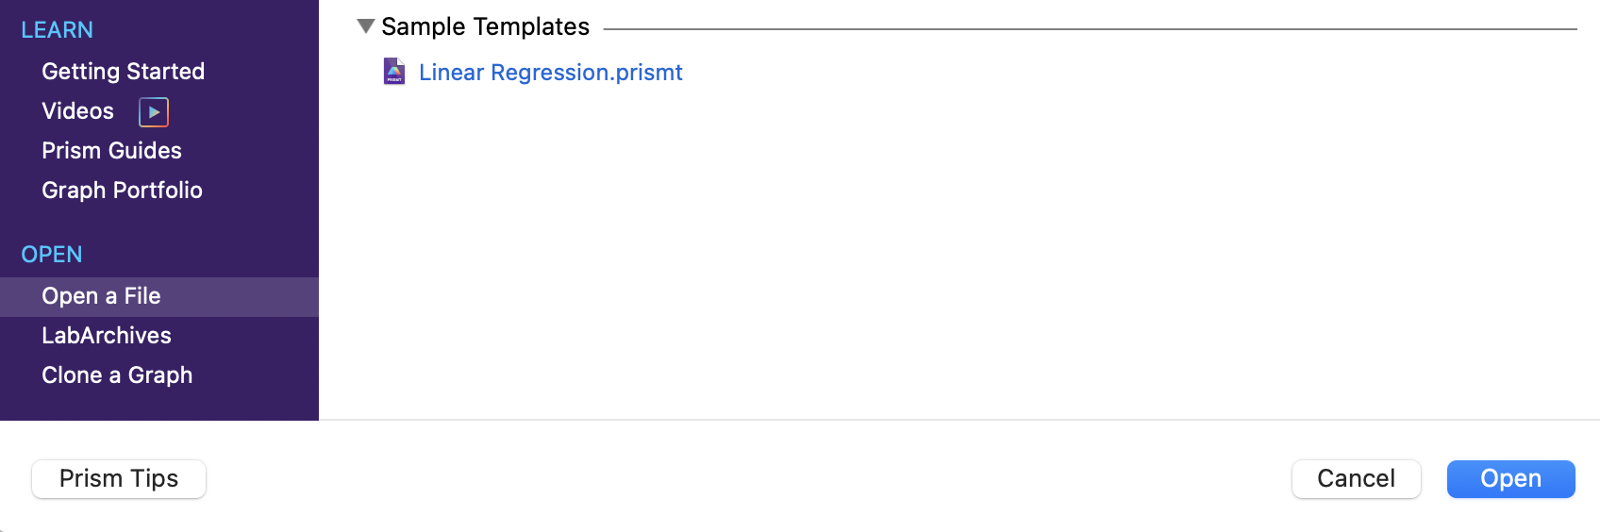
Click the Linear Regression.prismt template and enter new data. Although the curve may look the same at first glance, it is actually based on the new data and likely has a re-scaled Y-axis. The updated slope of the regression line is written on the graph. Click on the Results tab to see the updated regression analysis.
Templates, Methods, and Wand
Don't mix up the three. Use a Template when you're starting a brand-new project and want it to pre-populate the same graphs and analyses as another project. This is especially useful if this is a format you'll keep reusing going forward. Use a Method when you already have a project open with data entered and want to apply a previously saved method to generate specific graphs and analyses within it. And use the Wand when you haven't set up anything in advance (no Template, no saved Method), but you just want to take the same graphs and analyses that were created for one table and apply that approach to all the other data tables within that same file.
Keywords: prism templates