
What is the difference between ordinal, interval and ratio variables? Why should I care?
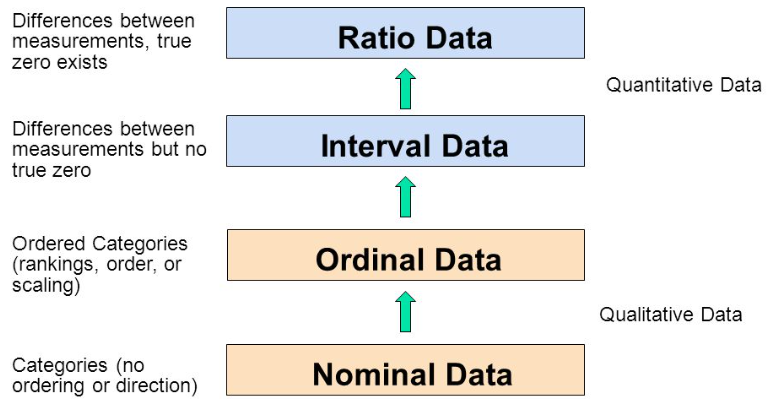
In the 1940s, Stanley Smith Stevens introduced four scales of measurement: nominal, ordinal, interval, and ratio. These are still widely used today as a way to describe the characteristics of a variable. Knowing the scale of measurement for a variable is an important aspect in choosing the right statistical analysis.
Nominal
A nominal scale describes a variable with categories that do not have a natural order or ranking. You can code nominal variables with numbers if you want, but the order is arbitrary and any calculations, such as computing a mean, median, or standard deviation, would be meaningless.
Examples of nominal variables include:
-
genotype, blood type, zip code, gender, race, eye color, political party
Ordinal
An ordinal scale is one where the order matters but not the difference between values.
Examples of ordinal variables include:
-
socio economic status (“low income”,”middle income”,”high income”), education level (“high school”,”BS”,”MS”,”PhD”), income level (“less than 50K”, “50K-100K”, “over 100K”), satisfaction rating (“extremely dislike”, “dislike”, “neutral”, “like”, “extremely like”).
Note the differences between adjacent categories do not necessarily have the same meaning. For example, the difference between the two income levels “less than 50K” and “50K-100K” does not have the same meaning as the difference between the two income levels “50K-100K” and “over 100K”.
Make more informed and accurate analysis choices with Prism. Start your free Prism trial.
Interval
An interval scale is one where there is order and the difference between two values is meaningful.
Examples of interval variables include:
-
temperature (Farenheit), temperature (Celcius), pH, SAT score (200-800), credit score (300-850).
Ratio
A ratio variable, has all the properties of an interval variable, and also has a clear definition of 0.0. When the variable equals 0.0, there is none of that variable.
Examples of ratio variables include:
-
enzyme activity, dose amount, reaction rate, flow rate, concentration, pulse, weight, length, temperature in Kelvin (0.0 Kelvin really does mean “no heat”), survival time.
When working with ratio variables, but not interval variables, the ratio of two measurements has a meaningful interpretation. For example, because weight is a ratio variable, a weight of 4 grams is twice as heavy as a weight of 2 grams. However, a temperature of 10 degrees C should not be considered twice as hot as 5 degrees C. If it were, a conflict would be created because 10 degrees C is 50 degrees F and 5 degrees C is 41 degrees F. Clearly, 50 degrees is not twice 41 degrees. Another example, a pH of 3 is not twice as acidic as a pH of 6, because pH is not a ratio variable.
Learn more about the difference between nominal, ordinal, interval and ratio data with this video by NurseKillam
|
OK to compute.... |
Nominal |
Ordinal |
Interval |
Ratio |
|
Frequency distribution |
Yes |
Yes |
Yes |
Yes |
|
Median and percentiles |
No |
Yes |
Yes |
Yes |
|
Add or subtract |
No |
No |
Yes |
Yes |
|
Mean, standard deviation, standard error of the mean |
No |
No |
Yes |
Yes |
|
Ratios, coefficient of variation |
No |
No |
No |
Yes |
Does measurement scale matter for data analysis?
Knowing the measurement scale for your variables can help prevent mistakes like taking the average of a group of zip (postal) codes, or taking the ratio of two pH values. Beyond that, knowing the measurement scale for your variables doesn’t really help you plan your analyses or interpret the results.
Note that sometimes, the measurement scale for a variable is not clear cut. What kind of variable is color? In a psychological study of perception, different colors would be regarded as nominal. In a physics study, color is quantified by wavelength, so color would be considered a ratio variable. What about counts?
There are occasions when you will have some control over the measurement scale. For example, with temperature, you can choose degrees C or F and have an interval scale or choose degrees Kelvin and have a ratio scale. With income level, instead of offering categories and having an ordinal scale, you can try to get the actual income and have a ratio scale. Generally speaking, you want to strive to have a scale towards the ratio end as opposed to the nominal end.
Save time performing statistical analysis with Prism. Try Prism for free.
Test your understanding of Nominal, Ordinal, Interval, and Ratio Scales
Each scale is represented once in the list below.
- Favorite candy bar
- Weight of luggage
- Year of your birth
- Egg size (small, medium, large, extra large, jumbo)
Each scale is represented once in the list below.
- Military rank
- Number of children in a family
- Jersey numbers for a football team
- Shoe size
Answers: N,R,I,O and O,R,N,I
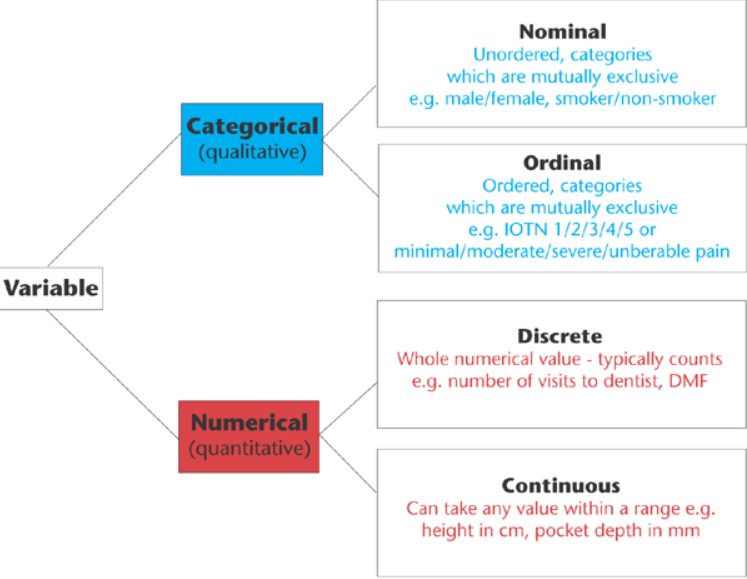
Quantitative (Numerical) vs Qualitative (Categorical)
There are other ways of classifying variables that are common in statistics. One is qualitative vs. quantitative. Qualitative variables are descriptive/categorical. Many statistics, such as mean and standard deviation, do not make sense to compute with qualitative variables. Quantitative variables have numeric meaning, so statistics like means and standard deviations make sense.
This type of classification can be important to know in order to choose the correct type of statistical analysis. For example, the choice between regression (quantitative X) and ANOVA (qualitative X) is based on knowing this type of classification for the X variable(s) in your analysis.
Quantitative variables can be further classified into Discrete and Continuous. Discrete variables can take on either a finite number of values, or an infinite, but countable number of values. The number of patients that have a reduced tumor size in response to a treatment is an example of a discrete random variable that can take on a finite number of values. The number of car accidents at an intersection is an example of a discrete random variable that can take on a countable infinite number of values (there is no fixed upper limit to the count).
Continuous variables can take on infinitely many values, such as blood pressure or body temperature. Even though the actual measurements might be rounded to the nearest whole number, in theory, there is some exact body temperature going out many decimal places That is what makes variables such as blood pressure and body temperature continuous.
It is important to know whether you have a discrete or continuous variable when selecting a distribution to model your data. The Binomial and Poisson distributions are popular choices for discrete data while the Gaussian and Lognormal are popular choices for continuous data.
Test your understanding of Discrete vs Continuous
The list below contains 3 discrete variables and 3 continuous variables:
- Number of emergency room patients
- Blood pressure of a patient
- Weight of a patient
- Pulse for a patient
- Emergency room wait time rounded to the nearest minute
- Tumor size
Answers: d,c,c,d,d,c
Note, even though a variable may discrete, if the variable takes on enough different values, it is often treated as continuous. For example, most analysts would treat the number of heart beats per minute as continuous even though it is a count. The main benefit of treating a discrete variable with many different unique values as continuous is to assume the Gaussian distribution in an analysis.
Keywords: levels of measurement