
Bug: X axis numbering can automatically change from X values to Column Titles in bar graphs of frequency distributions.
This is a new bug in GraphPad Prism 5.03 and 5.0c (to be fixed in 5.04 and 5.0d), easy to bypass. The bug only occurs when you follow these steps.
Grouped bar graph
- Create a data table with two or more data sets.
- Click Analyze and choose Frequency Distribution.
- At the bottom of the Frequency Distribution analysis, Prism lets you choose one of four types of graphs. Choose "Bar graph. Grouped".
- Prism labels each set of bars with the column title to identify the group. If you prefer to label each bar with the mid value of its bin, double clicking on the X axis, and change the drop-down for Number Format to "X Values".
- Go to the Preferences dialog, File&Printer tab, and check the option to "Save compact".
- Save the file.
- Open the file. You'll see that the X axis labels have reset to Column Titles.
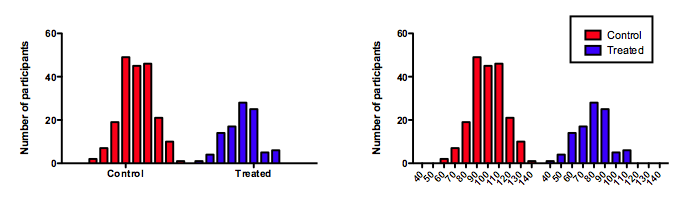
The graph below shows the two kinds of labels. The graph on the left is labeled with column titles. The graph on the right is labeled with X values. Download the Prism file.
The best workaround, for all files, is to go to the Preferences dialog, File&Printer tab, and uncheck the option "Save compact". That will solve the problem entirely. if the file is not saved compact, Prism will not recompute the results when it opens and the X labels won't change.
If, for some reason, you want to keep saving the file in compact format, you can bypass the problem for an individual file. Go to the Frequency Distribution results, drop the Edit menu and choose Freeze sheet. Now the results will not be recomputed when the file is opened, so the graph labels won't change.
Interleaved bar graph
If you choose to make an interleaved bar graph from the frequency distribution analysis, Prism will label the X axis with X values. If you then save the file as a .PZF file, the graph will change to Column Title labels (one label per bar). If you then double-click on the X axis and change the labeling to X values, the change will stick. Once you change the axis manually, it won't automatically change again.
If you save the graph as a pzfx file (instead of .pzf) the axis labeling won't change.