
I have multiple data sets, and the X values are not identical among all sets. How do I enter data into Prism?
Approach 1: Put all data onto one data table
Each table only has one X column, but it is ok to leave values blank. Below is a Prism data table for three data sets; some have X values common to all three, some common to two, some used by only one. For most purposes, Prism isn't fazed by empty cells or rows.

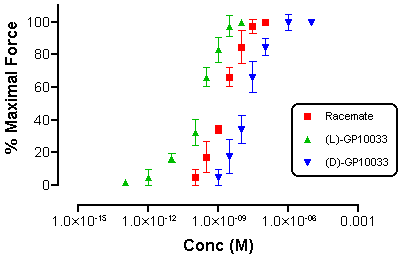
You might even find it easier to tabulate one data set in your first several rows, then another set in the next several rows, and so forth. There's no rule against listing the same value of X more than once. Just remember that the Y coordinates for different experimental groups (i.e., different data sets) must go under different columns (A, B, C,...). We dressed the graph up a bit, but here's a plot of the data above...honest!
Approach 2: Use several data tables
Each analysis can only use one table as an input. So if you want to compare groups, or do global curve fitting, then you need to put all the data onto one table as shown above.
If you only want to graph the data, then it is fine to use two or more tables. By default, Prism creates one graph per data table. But that is just a starting point. You can plot data from multiple data tables on a graph. There are two ways to add another data table to a graph:
- Drag the other table from the navigator and drop it onto the graph.
- Double click on the graph to bring up the Format Graph dialog (Prism 5). Then go to the middle 'Data on Graph' tab. Then click Add...
Keywords: get by, staggered, stagger, offset, one X column, many X many Y, many X, many Y