
Tutorial: Plotting dose-response curves.
This example shows the basics of creating and customizing an XY graph (for this example, a set of two dose-response curves).
How to do it:
Start by creating an XY data table to enter the data. You can set up your data table with replicates and have Prism calculate your error values, or you can enter your error values directly. For this example, we'll create an XY data table, and choose the option "Enter 3 replicate values in side-by-side subcolumns" for the "Y" options.
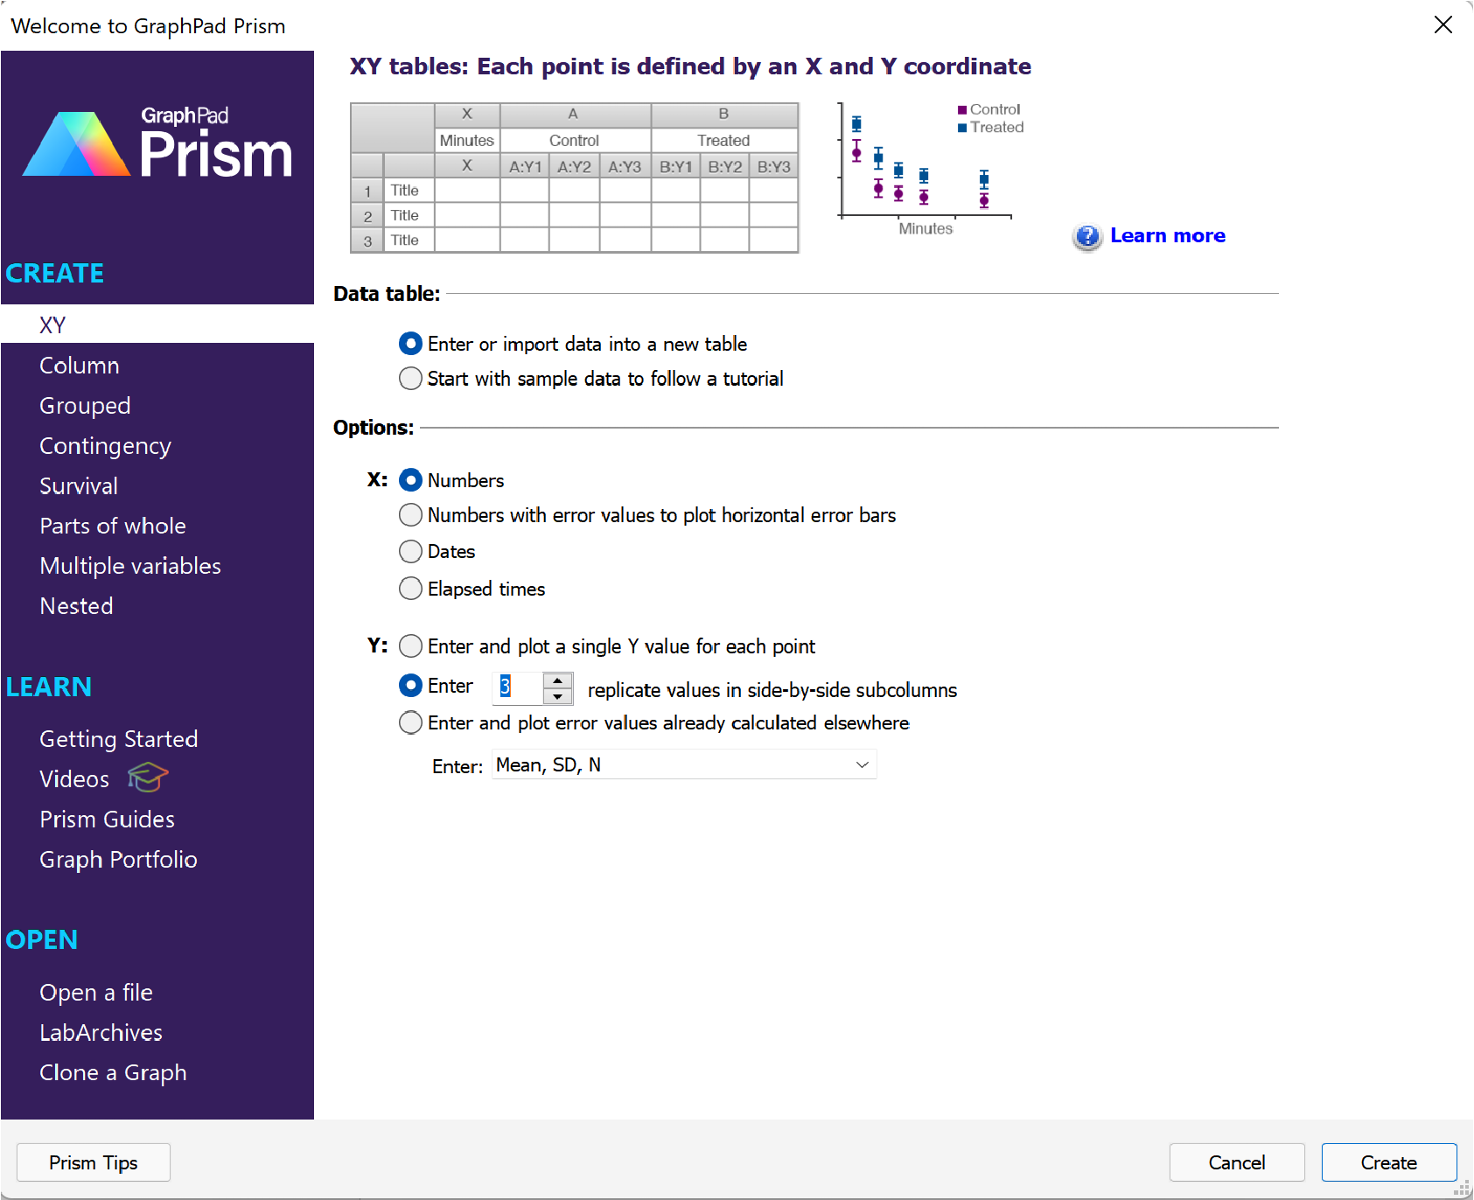
After clicking Create, the XY table will be shown and the data can be entered (as shown below). If you need to change the number of replicate subcolumns, click on the Table Format button in the upper/left corner of the data table. These data include a single X value representing the concentration of an agonist and two sets of response values ("No inhibitor" and "Inhibitor"), with replicate response values entered into appropriate subcolumns in the appropriate row (agonist concentration) and column (group). The rest of this guide will explore one way that these data can be analyzed via nonlinear regression to create a dose-response curve.

Before moving on, it's important to note that dose-response curves can be created directly from the amount (concentration) of agonist/antagonist. However, because these concentrations often span many orders of magnitude, it's common to log-transform these concentration values before performing nonlinear regression. In this example, we will transform the data before performing nonlinear regression, but Prism can handle either form of data input.
To transform the concentration data, start by clicking the Analyze button in the toolbar.

This will bring up the Analyze Data dialog. We're going to specify the log-transformation of the X values manually, so we'll select "Transform" in the "Transform, Normalize..." section of analyses (you can find this quickly by typing "Transform" into the search bar). Alternatively, we could use the "Transform concentrations (X)" analysis to apply a log-transformation without specifying the transformation directly, but we won't be using that approach in this example. Once you've selected "Transform", click "OK".

Now, the "Parameters: Transform" dialog should be displayed. The values that we want to transform are our X values, so we'll check the box next to "Transform X values using", and then select "X=Log(X)" from the corresponding dropdown menu. Be sure that the box next to "Create an new graph of the results" is checked, and click "OK"
![]()
Prism will now display the results of the transformation analysis on a results sheet with a green grid (indicating that we can directly use this data as input for subsequent analyses). Starting with this transformed data, we can perform nonlinear regression to generate a dose-response curve. Once again, click the Analyze button in the toolbar, and this time select "Nonlinear regression (curve fit)" and click "OK".

The "Parameters: Nonlinear regression" dialog will now be displayed, and we'll want to find the equation/model that we want to use to generate our dose-response curve. On the "Model" tab, find expand the "Dose-response - Stimulation" group of equations, and then select the specific model "log(agonist) vs. response -- Variable slope (four parameters)".

We'll leave the other options for this analysis set to their defaults, and click "OK". This generates a new results sheet with all of the important results from the regression including parameter estimates, confidence intervals, and goodness-of-fit metrics. Additionally, the curves generated by this analysis have been added to the graph of the data. In the navigator, click on the graph of the transformed data to see these curves. The default graph might look something like this:

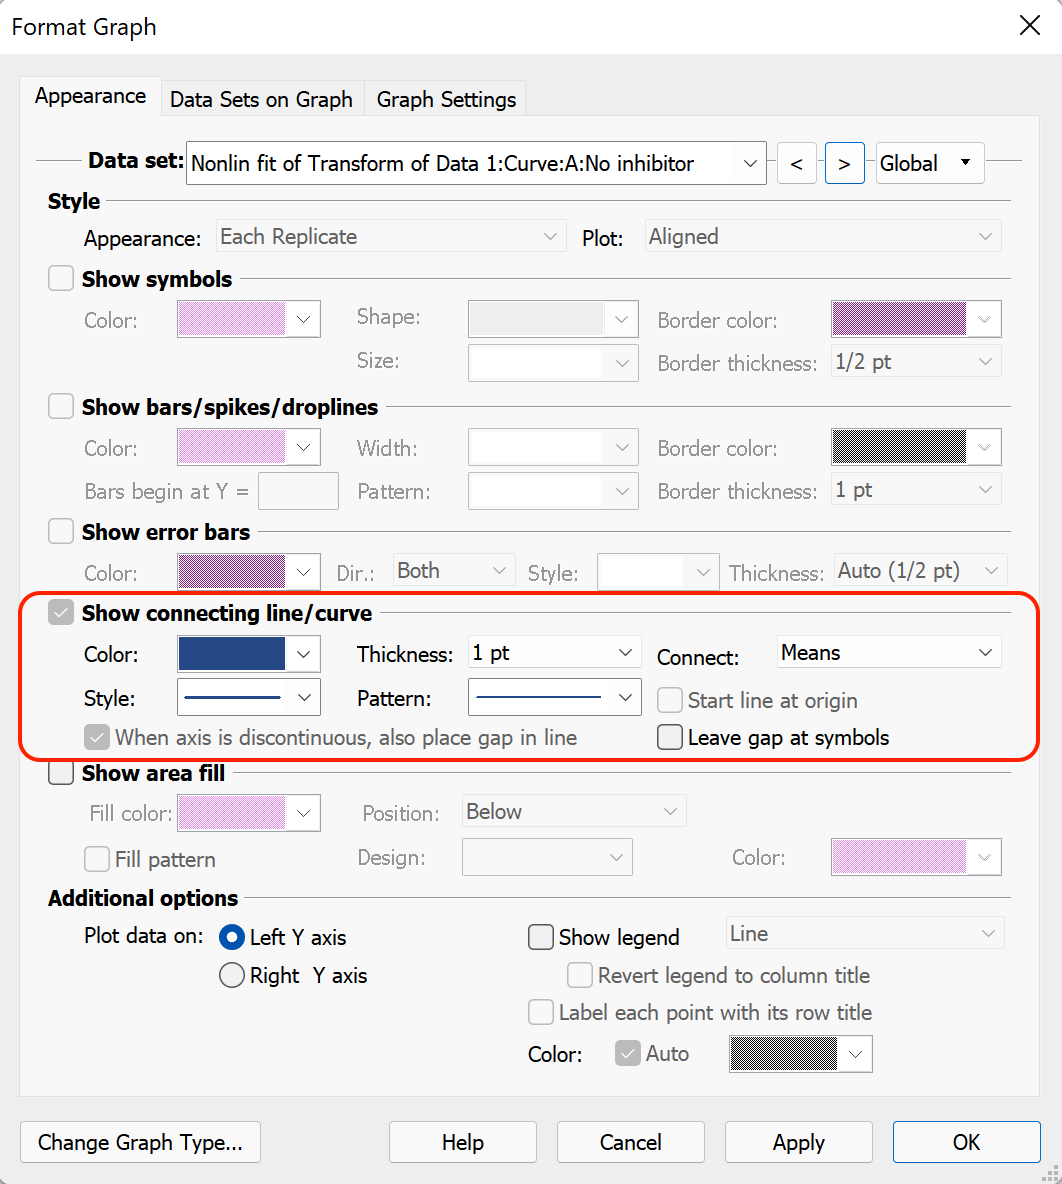
There are a lot of ways to improve the appearance of this graph. To begin, double-click anywhere in the graphing area to bring up the Format Graph dialog. At the top of the "Appearance" tab of this dialog, we're going to use the "Data set" dropdown menu to make sure that we have our first data set (not a curve) selected.

Then, using the options on this tab, we're going to customize this graph with the following settings:
- Use the "Appearance" dropdown menu in the "Style" section to plot "Each Replicate"
- In the "Show symbols" section
- Use the "Shape" dropdown to select the empty circle shape
- Use the "Color" dropdown to specify a light blue fill color
- Use the "Border color" dropdown menu to specify a dark blue border color
- Use the "Border thickness" dropdown menu to specify a thin (1/2 pt) border

Now, in the "Data set" dropdown menu, we'll select our second data set (not a curve) and apply a similar set of options to these symbols. This time, however, we'll use an empty square shape, and apply a light green fill and a dark green border.

Finally, we'll use the "Data set" dropdown to select each of the curves (not data sets) and make sure that the thickness of the curve is high enough to be visible (we used a thickness of 1 pt for both curves).

At this point, your graph should look something like this:

In order to get the axes of the graph to be offset, double click on either axis (or click on the Format Axes toolbar button) to bring up the "Format Axes" dialog, and select the first tab "Frame and Origin". In the top section "Origin", use the "Set origin" dropdown menu to specify "Lower left" as the origin location. In the bottom section "Frame and Grid Line", use the "Frame style" dropdown menu to select "Offset X & Y axes". Also on this tab, you can change the thickness of the axes in the "Axes and colors" section (we used 1/2 pt for the example graph).

Finally, to give this graph the appearance of a logarithmic X axis, click on the "X axis" tab of this dialog. Uncheck the box beside "Automatically determine the range and interval", and set the "Minimum" and "Maximum" values to -10, and -3, respectively. In the "Regularly spaced ticks" section, use the following settings:
- Major ticks interval: 1
- Starting at X= -10
- Minor ticks: 9 (check the box beside "log")
- Number format: Power of 10

Now, the graph should look very nearly complete. The final steps to polish the graph include:
- Deleting the Graph Title and Y axis title
- Selecting and dragging the legend into the frame of the graph to conserve space
- Unbolding the X and Y axis labels
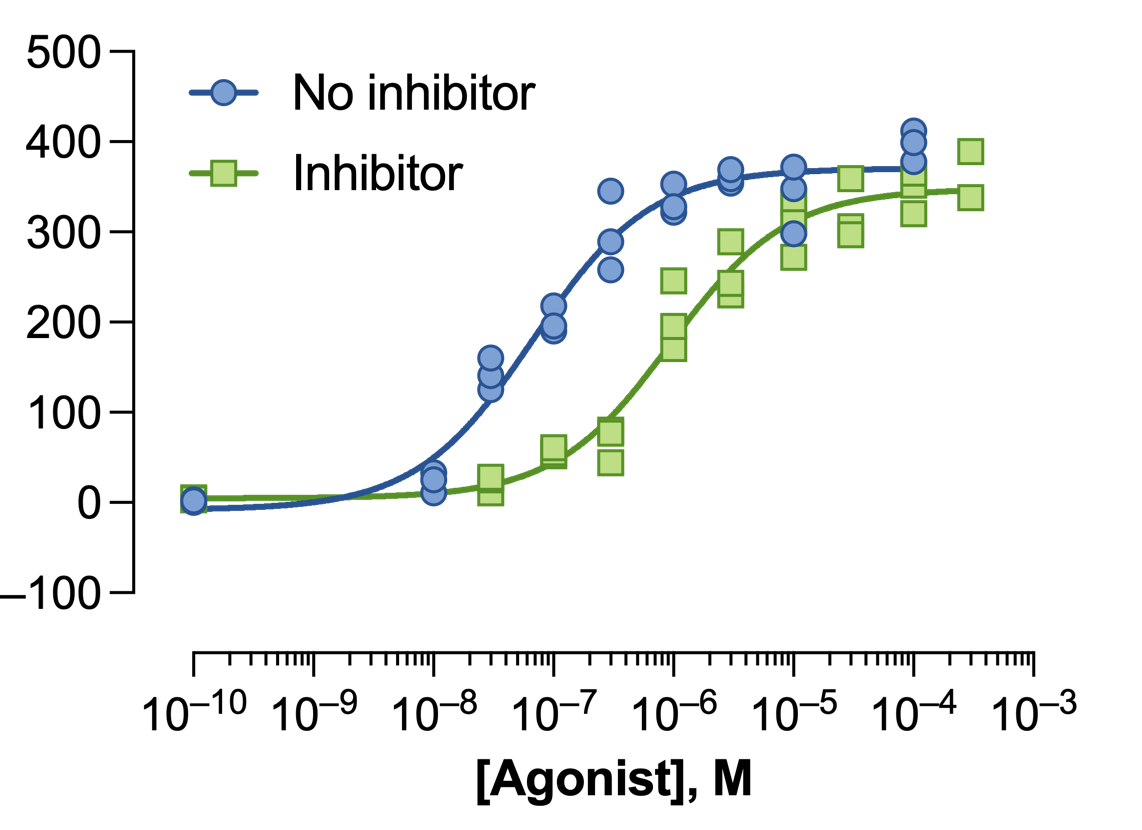
With this complete, the polished graph should now look like this:
And you're done!
Download this file to see how this graph was made.