




Two way ANOVA
Two-way analysis of variance may be used to examine the effects of two categorical variables (factors), both individually and together, on an experimental response. Suppose you've studied the effects on heart rate of three experimental treatments (factor 1) before and during exercise (factor 2). Two-way ANOVA, in combination with post testing, can answer the following questions:
- Is there an effect of treatment on heart rate?
- Is there an effect of exercise on heart rate?
- Is there interaction between the factors? That is, does the affect of treatment differ between exercise states, or equivalently, does the effect of exercise differ among treatments?
- At which treatments is there a significant difference between exercise levels?
To learn more about two-way analysis of variance, consult the Statistics Guide. If you have only two data groups to compare, try the step-by-step example on t tests. If you have more than two groups, but the data are grouped by two factors, refer to step-by-step on one-way ANOVA.
Enter the Data
When you launch Prism, the Welcome to Prism dialog appears. Choose to Create a Grouped data table.
Data entry for two-way ANOVA in Prism differs from that in most other statistics programs. With Prism, you enter your data onto a table as you'd normally illustrate the results, with the row-and-column position of each datum indicating the factor level.
In the lower half of the Welcome dialog, tell Prism how to format your data table. You can choose to enter a single Y value, enter replicate data, or enter mean, error, and sample size calculated elsewhere. For this example, we will enter 3 replicate values in side-by-side subcolumns.
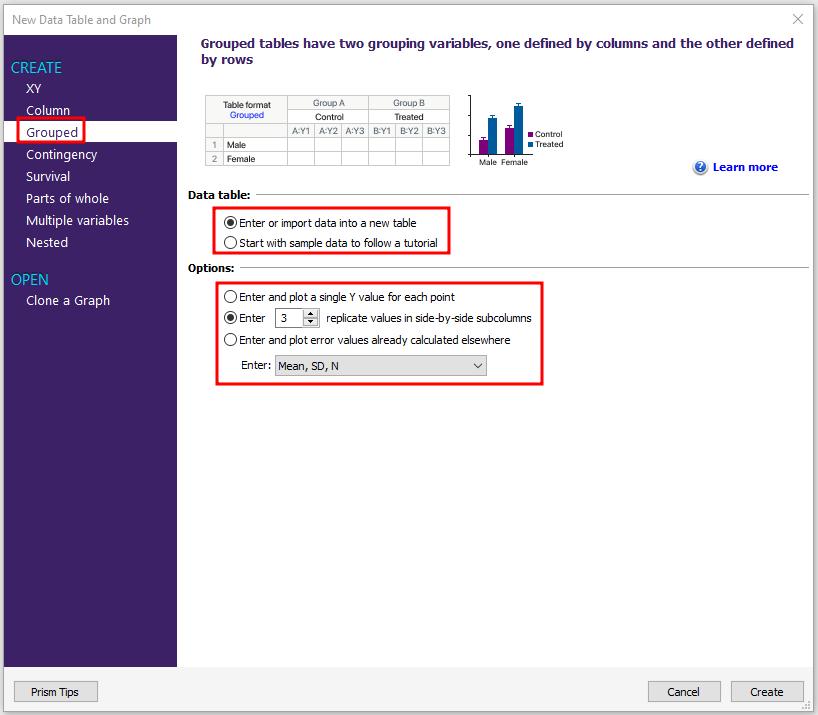
When you leave this dialog box, Prism displays the formatted table. Enter the data as shown below:
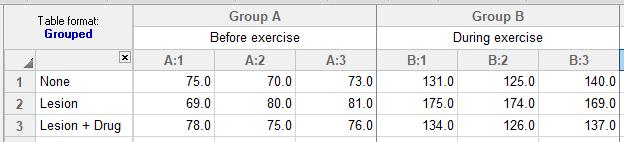
Although we instructed Prism to format the table for "3 replicates", in this example, the values in subcolumns Y1, Y2, and Y3 are matched measurements, not simple replicates (we'll indicate that when we enter the two-way ANOVA analysis parameters later).
You could also format the columns for entry of mean, either standard deviation (SD) or standard error (SEM), and sample size (N) (unless you want to do repeated-measures analysis, in which case you must provide individual replicate measurements).
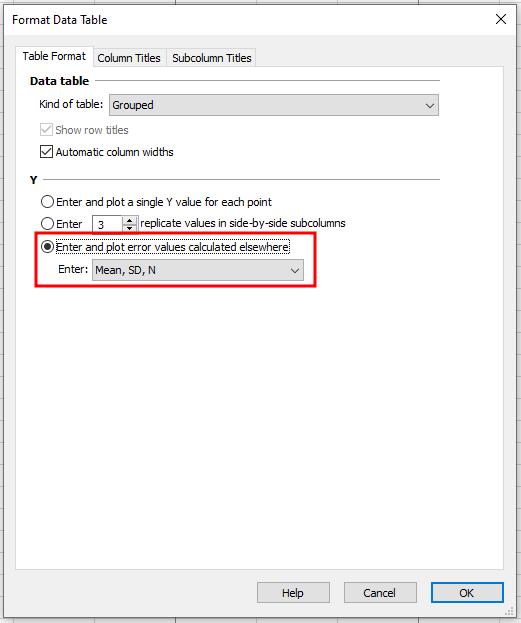
For this example, the data would look like this:
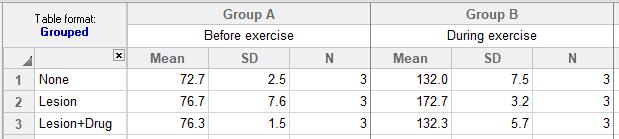
Click on the Graphs section of the Navigator (left) panel to view the bar chart that Prism has produced automatically. To start, Prism has selected an interleaved scatter plot with median.
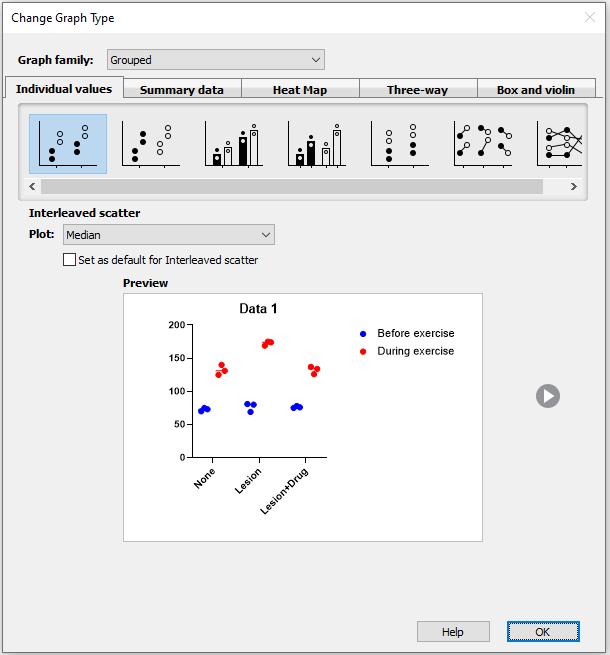
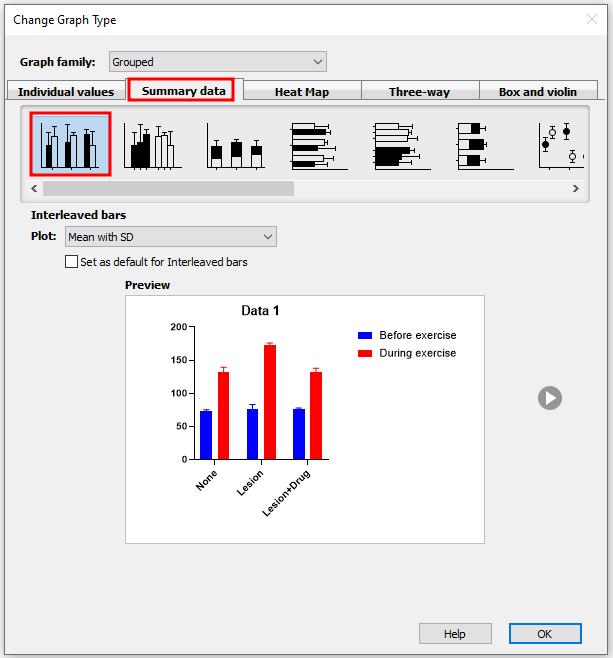
For this example, we will choose an Interleaved bar graph from the Summary data tab.
Choose the Analysis and the Options
Click on the Data Tables section to return to the data table. Click Analyze. In the Analyze Data dialog, select Grouped analyses and Two-way ANOVA (or mixed model).
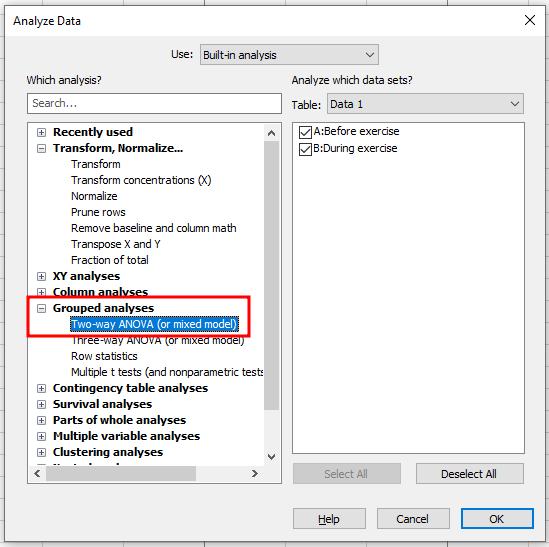
If you later change your mind about which data sets to analyze, click the Change button and choose Data Analyzed...
To start, tell Prism whether or not you have repeated measures, and if so, whether the measurements are repeated row-wise or column-wise. We'll assume that subjects were assigned to only one of the three treatment groups (None, Lesioned, Lesioned plus drug treated) but that measurements were made on each subject both before and during exercise. This is matching by row — the value in column A, Y1 was obtained from the same subject as the value in column B, Y1. The graphic will update depending on your selection to help you decide.
Note that the Repeated Measures section will be greyed-out if you do not provide individual replicate values.
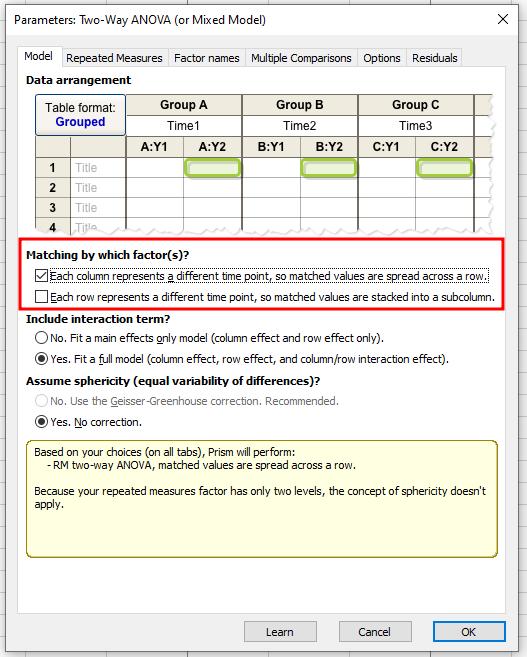
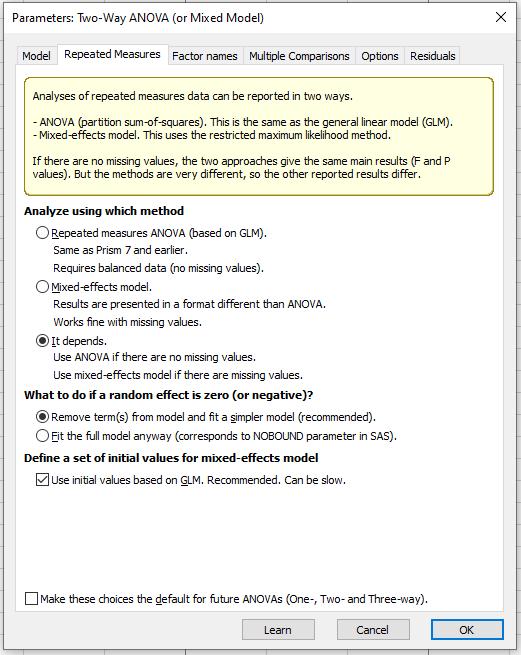
On the Repeated Measures tab, choose how to handle missing values and what to do if a random effect is zero.
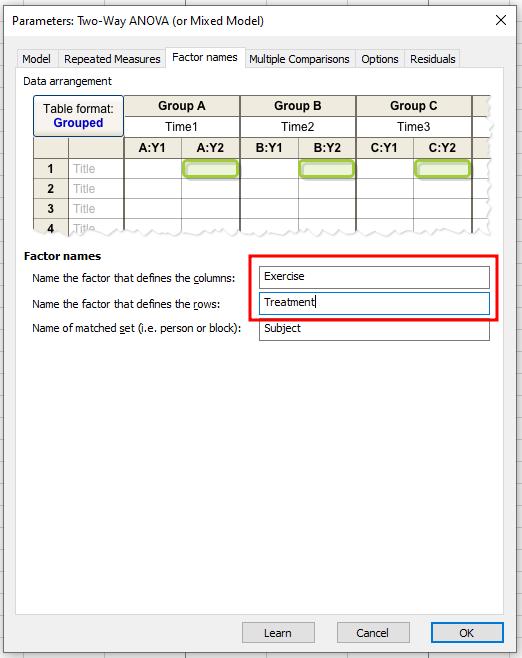
On the Factor names tab, enter names for the factors (variable names) defining the columns and the rows. This step is optional; it doesn't affect the computations, it just makes the output easier to follow.
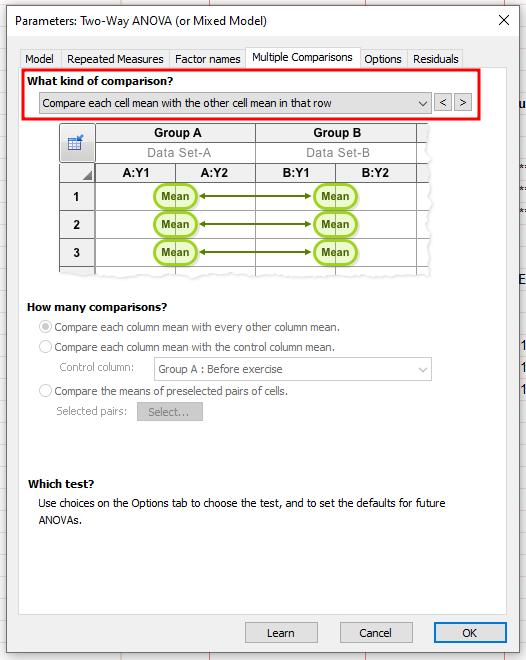
On the Multiple Comparisons tab, select what kind of comparison you want to make. For this example, we will select 'compare each cell mean with the other cell mean in that row'. For our data, this means comparing during exerise to before exercise for each treatment (none, lesion, and lesion+drug).
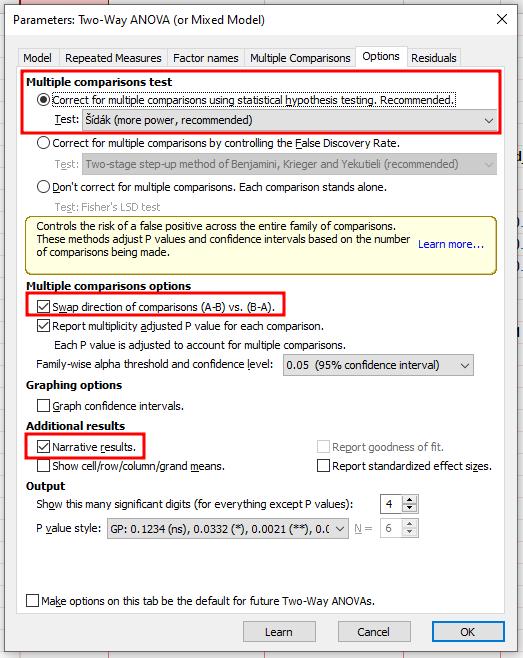
On the Options tab, you have many choices available. First, select what kind of multiple comparison test you want to run (Bonferroni, Sidak, etc.). Here we will choose options to swap the direction of comparisons (for clarity), and provide narrative results.
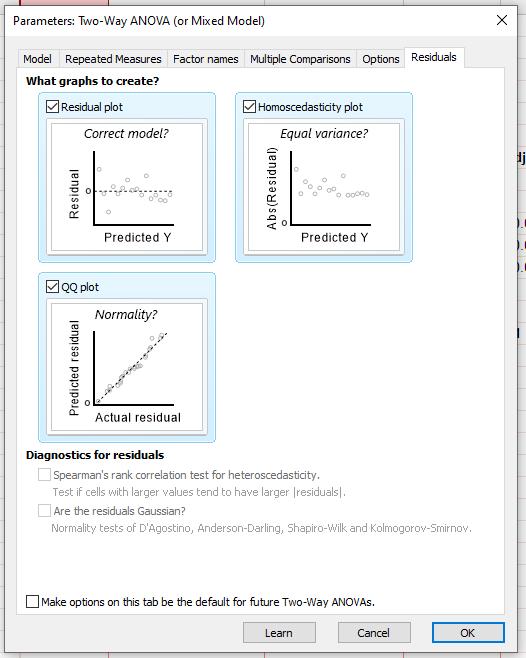
Finally, the Residuals tab offers three diagnostic plots with plain language guidance as to what they are for.
View the Results
When you leave the Parameters dialog by clicking OK, Prism runs the analysis. Due to our selections, the Results page for this example consists of three tabs: ANOVA results, mutliple comparisons, and narrative results.
Prism displays the ANOVA results tab first, indicating significant effects of both exercise and treatment, and interaction between the two factors (the effect of one factor is influenced by the level of the other factor, e.g., the difference in heart rate before exercise and heart rate during exercise is not the same with all treatments).

Further down the ANOVA results tab, the ANOVA table is presented...

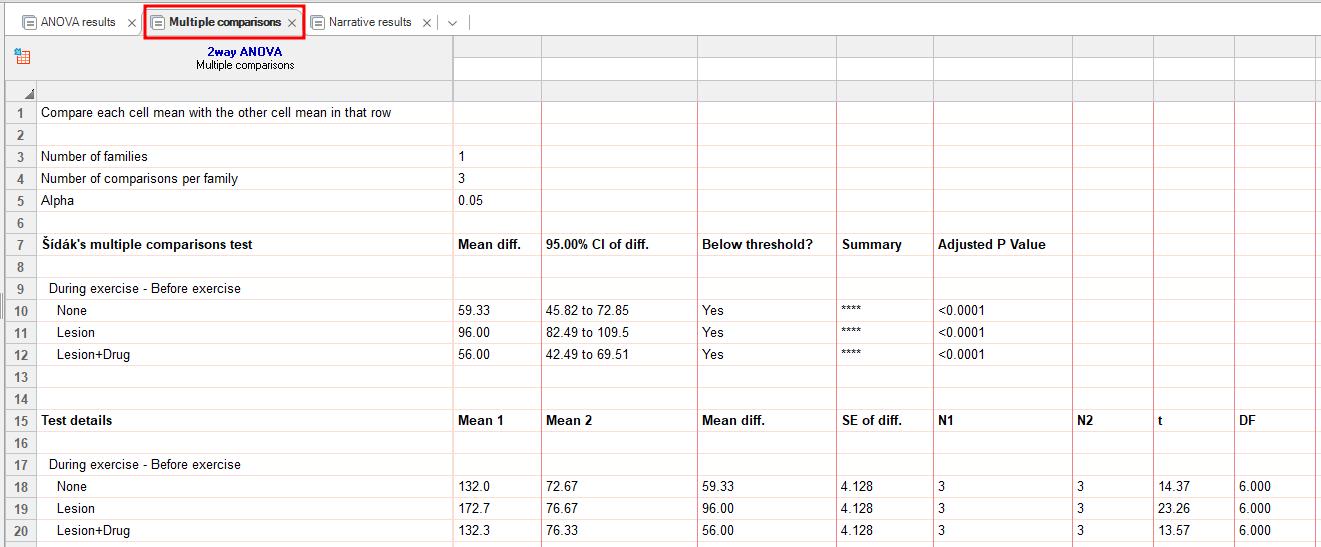
On the Multiple comparisons tab, we can see comparisons between during exercise and before exercise for each treatment group.
For an easy-to-understand synopsis of the results, switch to the Narrative results tab.
Here's a partial illustration of the narrative:
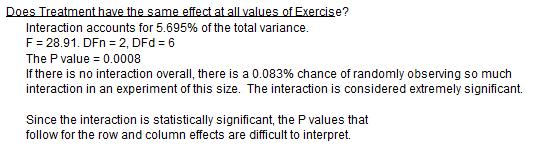
The narrative points out the "extremely significant" interaction (very small interaction P value), which makes the P values for factor (row and column) effects hard to interpret. It is particularly worthwhile in that case to investigate the results of the post tests. If the interaction P value had been high, suggesting a consistent difference from before to during exercise among all treatments, the post tests would not have been very helpful, and a different selection could be made.
Keywords: two way anova