




Creating a PowerPoint Slide from a Prism Graph
Prism and Microsoft PowerPoint are a popular combination for producing presentations. This article should help you use Prism and PowerPoint together effectively. In the discussion to follow, when we refer to moving and editing graphs, the information applies equally well to layouts.
How should you move your Prism graph into PowerPoint? Here are three options:
1. Send-to-PowerPoint (recommended)
The Send-to-PowerPoint command copies the current graph or layout, creates a new slide in PowerPoint, and pastes.
2. Copy/Paste
On Windows computers, where Object Linking and Embedding (OLE) is available, there are two pasting options:
- Embedding The Prism graph — and a copy of all data, analyses, and graphical settings needed to create the graph — are inserted into PowerPoint. You can double-click on the pasted graph in PowerPoint to edit it in a Prism environment. Changes that you make in this way affect only the PowerPoint file, not the source Prism file.
- Pasting a picture Only the graph is pasted — no links and no editing information. It's simple and space-efficient, but you can only edit the pasted image in PowerPoint. If you want to edit it in a Prism environment, you'll have to start again
The Mac has no OLE capability, so you don't face this choice of pasting methods. You can only paste a picture. See details.
3. Export/Import
This option saves a graph as a file, rather than via the clipboard. We'll say comparatively little about it in this article; the only time when exporting/importing is more convenient than copying/pasting is when you are moving the image to PowerPoint on a different computer.
Send-to-PowerPoint in Windows
Prism has "one-click buttons" available to send graphs or layouts to PowerPoint.

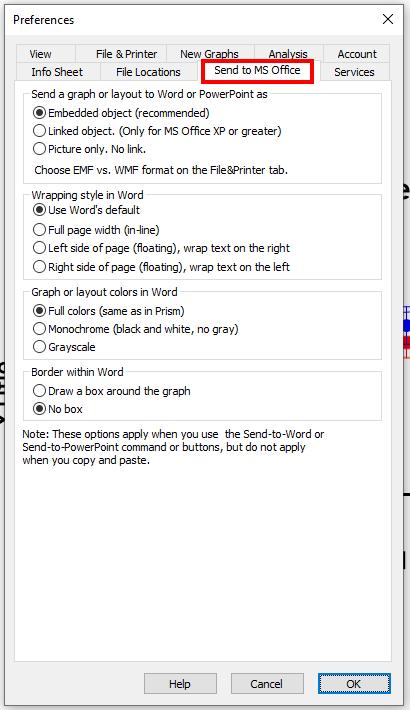
Choices in Prism's preference dialog determine whether Prism's one-click Send buttons send an object, a link, or a picture. To change this, open the Send to MS Office tab of the Prism Preferences dialog (found by going to Edit > Preferences on the menu bar).
Copy/Paste in Windows
In Prism, display the graph you want to copy. Choose Edit... Copy. There is no need to "select" the graph before copying — everything on the page will be copied to the clipboard (in the case of layouts, the entire layout will be transferred).
Switch to PowerPoint. Open, or navigate to, the slide where you wish to place the image. Now apply the desired pasting method:
- To paste/embed, simply choose Edit... Paste.
- To paste/link, or to paste a picture with no linking or embedding, choose Edit... Paste Special, which produces this dialog:
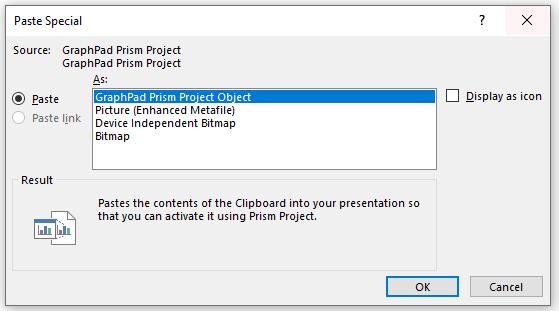
When the Paste radio button is selected, you have a choice of pasting formats. Pasting a GraphPad Prism Project Object results in the embedding already described. The other formats — pictures or bitmaps — can be useful for minimizing the size of your file or when you are pasting to a program that is not an OLE container. Since PowerPoint is OLE-capable, the bitmap choices will seldom, if ever, be best. Choosing Picture (Enhanced Metafile) gives best results when you wish to paste without embedding.
When you complete the Paste or Paste Special command, handles — small squares forming an outer boundary for the pasted graph appear first on the PowerPoint slide, followed by the graph. As long as the handles are visible, indicating that the image is selected, you can click and drag within the area bounded by the handles to move the entire graph, or click and drag on a particular handle to resize the graph. Click elsewhere to deselect the graph.
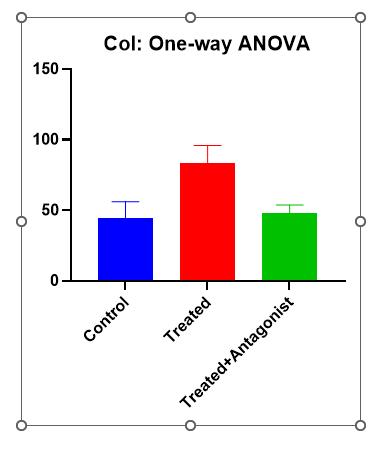
As discussed earlier, simple pasting embeds the graph. If you used that method, you can verify the embedding by double-clicking on the pasted graph. You are returned to Prism, and a copy of the graph appears, ready for editing. You are not limited to editing the graph directly; you may also edit the data in an embedded file, and any consequent changes to the graph, or to analyses linked to the graph, will be made automatically. Remember that editing changes you make here affect only the embedded file, not the source Prism file. As long as the graph is open for editing in Prism, it is unavailable in PowerPoint.
Close Prism and you are returned to the normal image in PowerPoint. The editing changes you made in Prism now appear in the PowerPoint copy.
Send-to-PowerPoint on the Mac
Prism also has "one-click buttons" available to send graphs or layouts to PowerPoint on the Mac. Note, there is no Object Linking and Embedding on the Mac. Prism will only paste a picture.
Copy/Paste on the Mac
With the Mac, there is a slight complication. The Mac operating system cannot copy vertical text — as text — to the clipboard. Prism gets around this problem by converting vertical text to a bitmap, but it is forced to do so at screen, not printer, resolution. This means that if you copy a graph at the screen size, vertical text may be printed with poor quality. Prism therefore has an integrated option to paste an enlarged copy of your image. The graph must be reduced after pasting, but the result is a sharper printed image. Prior to the first time you transfer a graph, tell Prism how much, if any, you want to enlarge it. Select Edit... Options... Graph Options. In the resulting dialog, "Copy to clipboard", you're offered the choices of transferring at up to twelve-fold enlargement. We recommend six-fold. This choice remains in effect until you change it again.
To actually do the transfer, follow the same procedure presented for simple pasting in Windows systems above, but note these tips:
- If you are pasting an enlarged copy, you can make PowerPoint reduce the pasted image automatically as follows: In the PowerPoint New Slide dialog, select a slide template containing a placeholder for a graph.
- Click only once on the placeholder to select it — if you click twice, PowerPoint inserts a "chart" from Microsoft Graph. Now choose Edit... Paste. The pasted image is sized to fit the placeholder. If you don't use a template with a placeholder, you'll need to reduce the pasted copy, either by dragging a corner handle inward, or by choosing Format... Object, from which you can specify exact dimensions for the copy.
- Remember that on the Mac, you've pasted only a picture. If you want to edit the image, either do it in PowerPoint or return to Prism to edit and paste a new copy.
Export/Import in Windows or Mac
This option moves a graph as a file, rather than via the clipboard. For transfers to PowerPoint, the option is probably useful only when moving the image to a different computer.
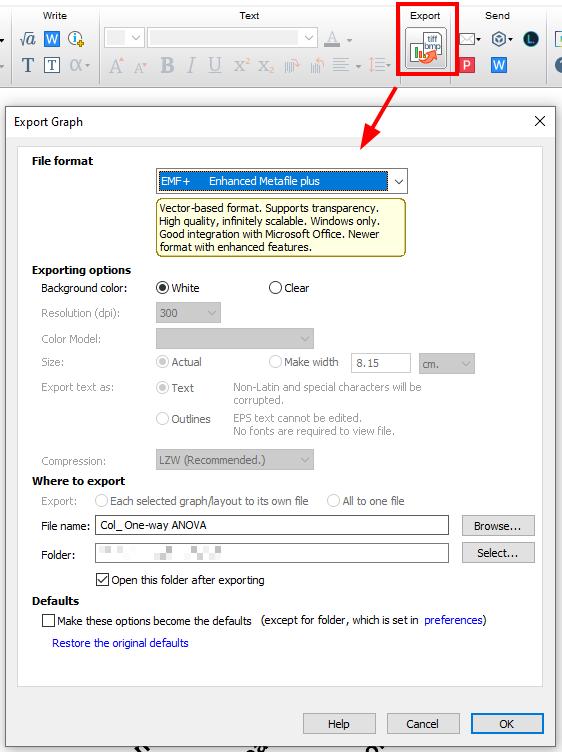
With the Prism graph sheet in view, choose File... Export, or press the button pictured below. In the "Export Graph" dialog, assign a file name, location, and format type.
In PowerPoint, with the destination slide in view, choose Insert... Picture... From This Device, then choose the appropriate file.
Background Effects
You can create colored backgrounds and/or colored plot areas within Prism, but if your graph is destined for PowerPoint, there may or may not be a point to doing so. When you paste a Prism graph to PowerPoint, backgrounds and plot areas are handled differently.
- The background is not pasted, so that users can easily exploit the more extensive background options available within PowerPoint without interference from a pasted background.
- Plotting areas are pasted, but when you choose to make the plotting area the same color as the background, Prism gives you the option of making the plotting areas transparent. This doesn't affect how the graph looks in Prism, but it prevents the plotting area color from showing up when the graph is pasted to PowerPoint.
Special effects, such as "gradient" backgrounds must be done in PowerPoint.
Reverse-Contrast Slides: An Illustration
If you're making an on-screen presentation, you'll likely be using light-colored (white) axes and text on a dark background. Here we show an easy method for making a white-on-blue slide with a simple "gradient" background, starting with the following Prism graph:
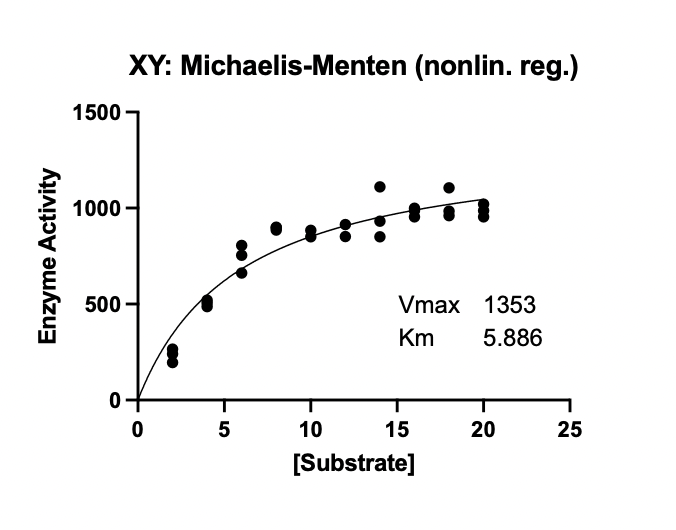
We recommend doing as much editing as you can in Prism before you move the image to PowerPoint. The final slide background will be created entirely in PowerPoint. However, both to facilitate editing and to help you see what you're doing when you actually paste the image, we'll begin by giving the graph a white-on-blue color scheme in Prism. When viewing the graph, look to the menu bar and select Change > Color Schemes > More Color Schemes > Diazo. Your graph is changed to the "reverse-contrast" scheme.
For this example, we are changing the color scheme as the quickest way to make a white-on-blue slide. But you should be aware that you can change the color of any element of your graph independently by clicking Change and selecting Background Color, Plotting Area Color, Axes Titles, etc.
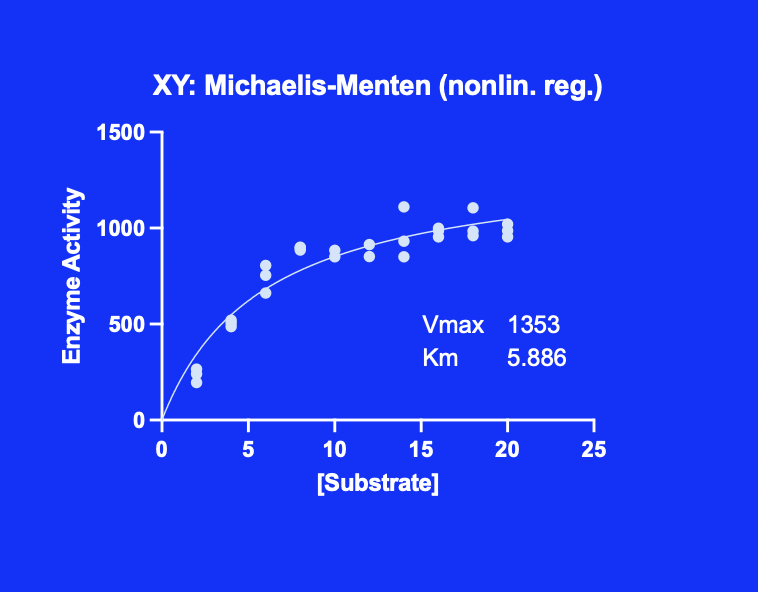
This slide actually contains two areas — a blue background area and a blue plotting area.
Keywords: powerpoint slide prism graph